Fix SOLIDWORKS System Resources Running Low
Understanding the Problem
“SOLIDWORKS has detected that your system resources are running low. It is recommended that you close some applications to free additional resources.”
System resources can refer to:
- Physical Memory – the amount of RAM on the system
- Virtual Memory / Page File – the virtual address space, or VRAM, for the SOLIDWORKS process
- Commit Charge – the amount of memory that the OS has committed to any process running on the computer
- Desktop Heap – OS memory reserved for USER Objects like windows, menus, cursors, icons, and menu keyboard shortcuts.
- GDI Objects – Resources that support graphics like fonts, bitmaps, brushes, pens, and drawing surfaces.
On 64-bit computers, this warning message typically refers to RAM, VRAM, or GDI Objects
Monitor these resources by navigating to:
- Physical Memory – Resource Monitor > Memory tab or Windows Task Manager > Performance tab.
- Alternatively, RAM can be monitored via a downloadable tool called RamMap. This tool will give a more in-depth look at how Windows is assigning physical memory.
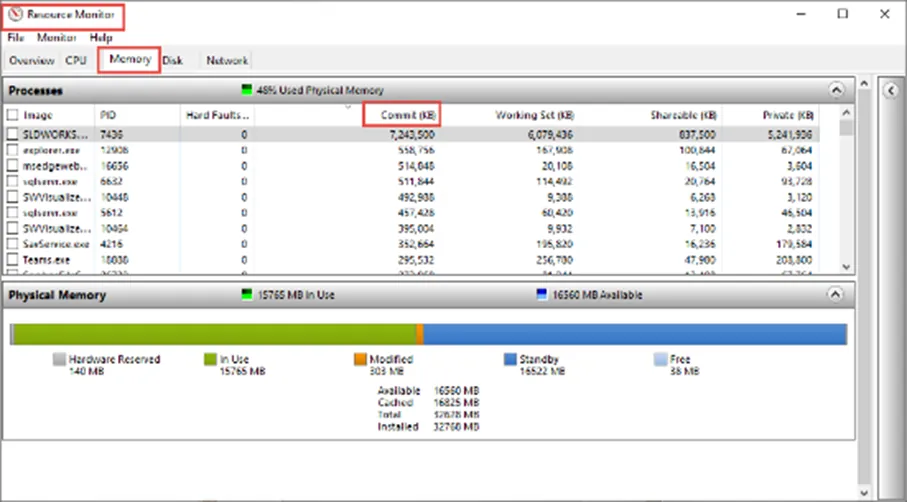
Figure 1: Resource Monitor
- Alternatively, RAM can be monitored via a downloadable tool called RamMap. This tool will give a more in-depth look at how Windows is assigning physical memory.
- Virtual Memory / Page File – Control Panel > Administrative Tools > Performance Monitor. Underneath Monitoring Tools, select Performance Monitor and select the green plus icon for add, choose Paging File from the list, select Add >>, then click OK.
- Alternatively, VRAM can be monitored via a downloadable tool called GPU-Z.
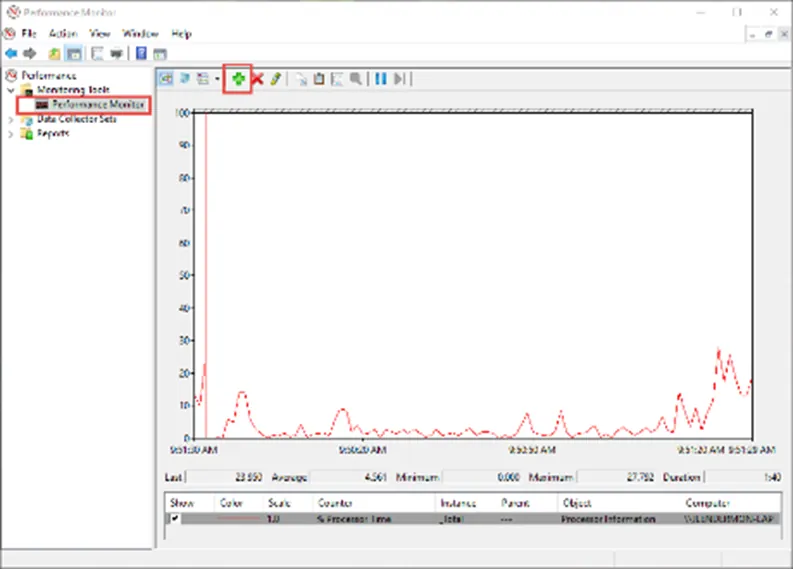
Figure 2: Performance Monitor
- Alternatively, VRAM can be monitored via a downloadable tool called GPU-Z.
- USER Objects –Windows Task Manager > Details tab
- GDI Objects – Windows Task Manager > Details tab
The USER Objects and GDI Objects column can be added by:
- Right-click on an existing column header and clicking Select Columns.
- Check the box for GDI Objects or USER Objects.
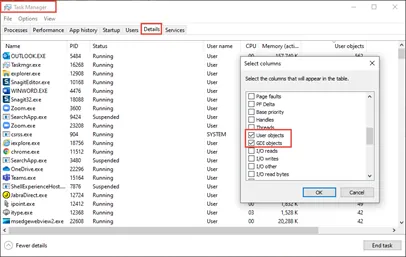
Figure 3: Task Manager-User and GDI Objects
Physical Memory has a percentage use out of 100 for us to monitor. The Paging File counter should stay below 75. By default, USER Objects or GDI Objects will trigger warnings if above 9,000 Objects.
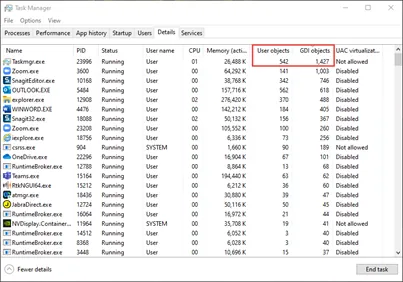
Figure 4: Task Manager User Objects / GDI Object
Solving the Problem – Physical or Virtual Memory
Closing and reopening SOLIDWORKS will release the memory. To improve Physical Memory performance, additional RAM may be added to the system. If the Paging File counter nears 100, installing more than one physical disk can assist or Virtual Memory can be modified.
Virtual Memory’s maximum is equal to double the installed physical RAM. By default, this virtual memory is managed by Windows, typically around 1.5 times installed physical RAM. You can verify or modify these settings by navigating to:
Control Panel > System > Advanced system settings > Performance Settings > Advanced tab > Change > uncheck Automatically manage paging file size for all drives > Custom size and increase the Initial size and Maximum size to twice the physical RAM.
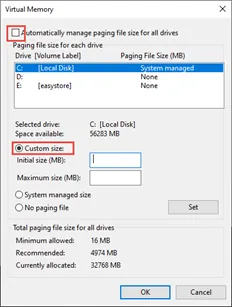
Figure 5: Virtual Memory
Note that newer computers running Windows 10 manage the RAM usage much more efficiently than older Windows 7 Systems and it is recommended to leave the default setting to Automatically manage paging size for all drives.
Monitoring the Commit Charge limit in the Resource monitor will show which processes consume the most committed memory. If there are processes that are not essential, they may be ended.
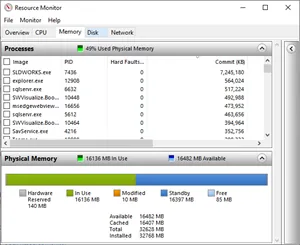
Figure 6: Commit Charge
USER Objects or GDI Objects
Closing windows within SOLIDWORKS, ensuring a proper graphics card and driver combination, or installing the most recent Service Pack of SOLIDWORKS may assist.
Windows 7 and Windows 10 default to 10,000 USER / GDI Objects allowed per process. Large assemblies, simulations, or having many part files open are reasons why the Windows Task Manager count may increase.
The registry can be edited to increase this maximum and thus delay the warning. A registry edit should be completed only if all other options are attempted.
The registry entry for both is within these two locations:
[HKEY_LOCAL_MACHINE\SOFTWARE\Microsoft\Windows NT\CurrentVersion\Windows]
[HKEY_LOCAL_MACHINE\SOFTWARE\Wow6432Node\Microsoft\WindowsNT\CurrentVersion\Windows]
Then USERProcessHandleQuota and GDIProcessHandleQuota respectively.
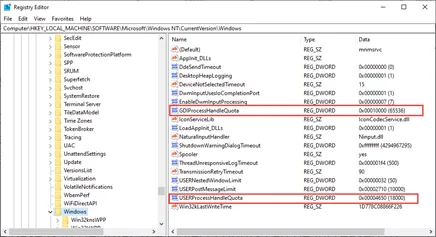
When the base is in Decimal, the Object counts can be increased to:
- USER Objects: 18000.
- GDI Objects: 65536.
GoEngineer wants to make this process easy for our customers. If you require further explanation or feel the system resources warning is due to a memory leak or other unknown error, please contact our Technical Support Team.
Editor's Note: This article was originally published in September 2017 and has been updated for accuracy and comprehensiveness.

SOLIDWORKS CAD Cheat Sheet
Our SOLIDWORKS CAD Cheat Sheet, featuring over 90 tips and tricks, will help speed up your process.
Want to Learn More?
Fix SOLIDWORKS Previous Toolbox Installed Blocking Upgrade
SOLIDWORKS Error: A Newer Version of this Application is Already Installed
Top 3 Causes of the SOLIDWORKS Journal File Warning

About Jeff Lendermon
Jeff Lendermon is an Applications Engineer for GoEngineer supporting the SOLIDWORKS Plastics simulation software. Jess has over 30 years of experience in the Plastic Injection molding industry, he applies his experience and knowledge of the industry to help customers see the benefits of utilizing the tools within SOLIDWORKS Plastics.
Get our wide array of technical resources delivered right to your inbox.
Unsubscribe at any time.