Frequency Study Plot with SOLIDWORKS Simulation
SOLIDWORKS Simulation Frequency Analysis gives two outputs and two outputs only. One, the user can see as many natural frequencies that cause the object they are analyzing to reach resonance and vibrate due to the energy being put into the system and the natural frequency of the object. Two, the user can see the displacement shape that each natural frequency the object makes called mode shapes as seen for the guitar string below.
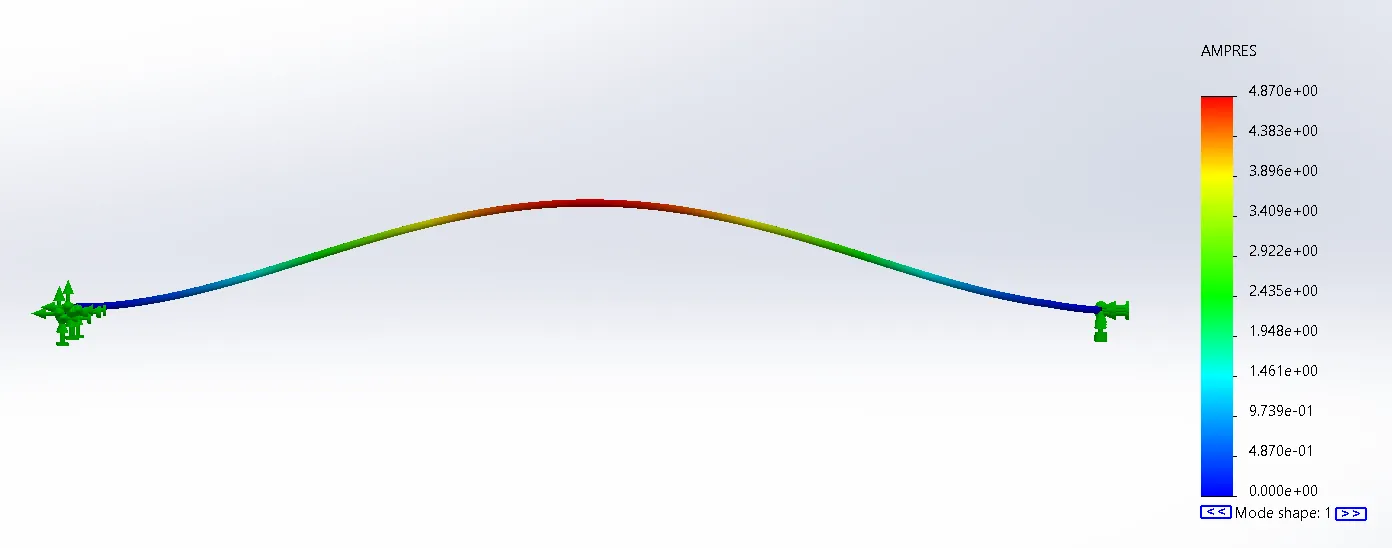
1st Natural Frequency and mode shape
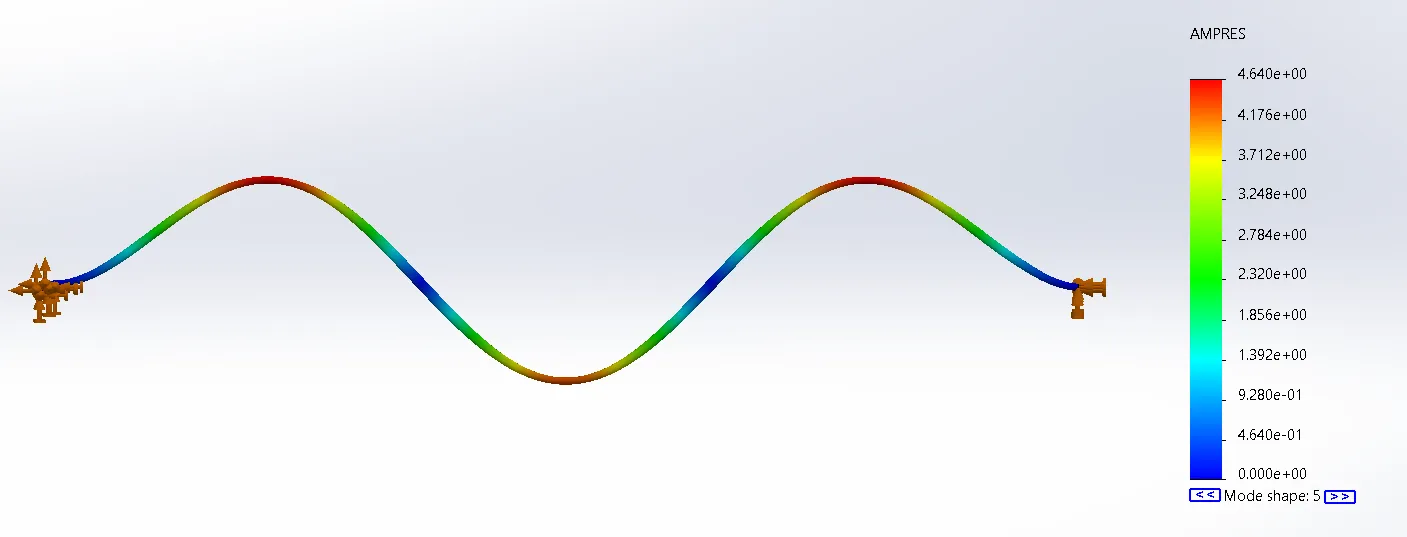
5th Natural Frequency and mode shape
What SOLIDWORKS Simulation frequency study will not give you are the stresses, strains, and displacements or any other information besides the natural frequencies and mode shapes of the object being analyzed.
Double Carrot Plot Walk Through Buttons
SOLIDWORKS 2018 introduced a new feature to some SOLIDWORKS Simulation Plots. They added two double carrot blue buttons at the bottom of the plot chart as shown below.
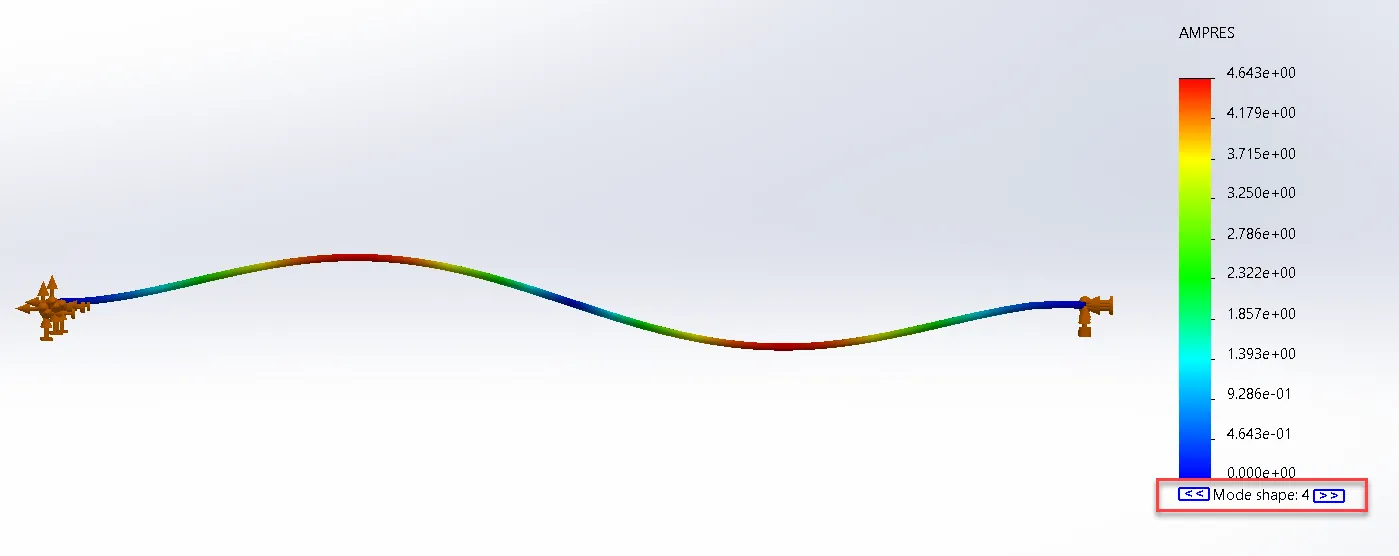
Mode shape plot with two double carrot blue buttons highlighted
These buttons were added to frequency, thermal, nonlinear, and linear dynamic studies. With them, the user no longer needs to create and switch between plots in the results folder but can stay in the same plot and step up and down to different time points in time-based studies or different natural frequencies and mode shapes in frequency studies by clicking on one of the blue buttons either up or down.
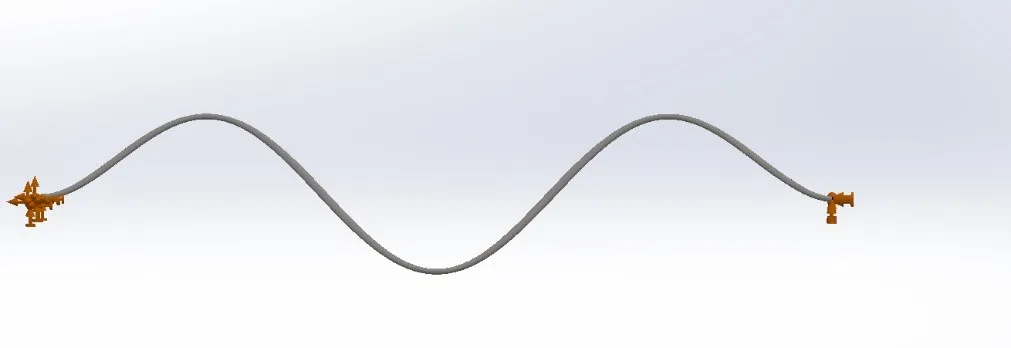
Colorless mode shape plots
Because the mode in a frequency study is dimensionless and only shows the shape of the displacement that would happen at that natural frequency and not the magnitude of the displacement colors in a frequency study plot are meaningless and some users like to turn them off. If you would like to turn the color off in your frequency plots there are two ways to do it.
The first way to make the plot colorless is to edit the definition of the plot that is currently open. Then at the bottom of the Definition tab in the Mode Shape/Amplitude Plot that was opened at the bottom of the Deformed shape section of this property manager, there is a checkbox called “Show colors”. All the user has to do to turn off the plot colors is to uncheck this checkbox.
Colorless mode shape plot
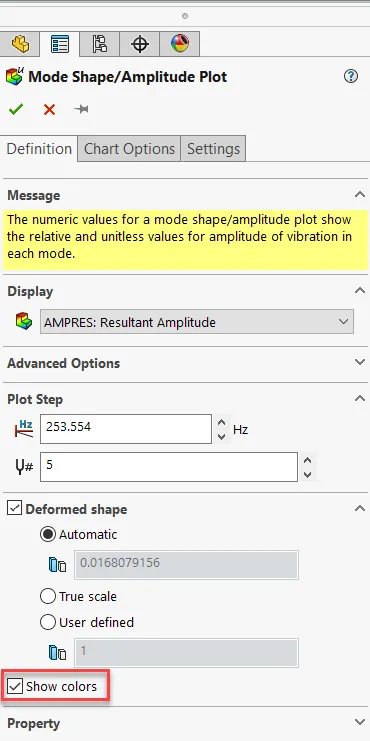
Show Colors Checkbox location highlighted
As you can see in the above screenshot, once the “Show colors” checkbox is cleared there is no longer a chart to go along with the mode shape. With the chart no longer available, the user's ability to walk through all the calculated natural frequencies and mode shapes using the two double carrot blue buttons is taken away. This is not an ideal option because the user now needs to go back to switching between the mode shapes by creating and activating the different plots in the Results folder. If the user also wants to turn off the color for all the plots they would need to deselect the “Show colors” box for each new plot which can be time-consuming and tedious.
The second way to make the plot colorless takes a bit more time to set up but once it is ready the user can switch between colorless mode shape plots using the two double carrot blue buttons exactly like they did when switching between mode shapes in the colored plots. The user will need to edit the definition of the plot that is currently open then activate the Chart Options tab.
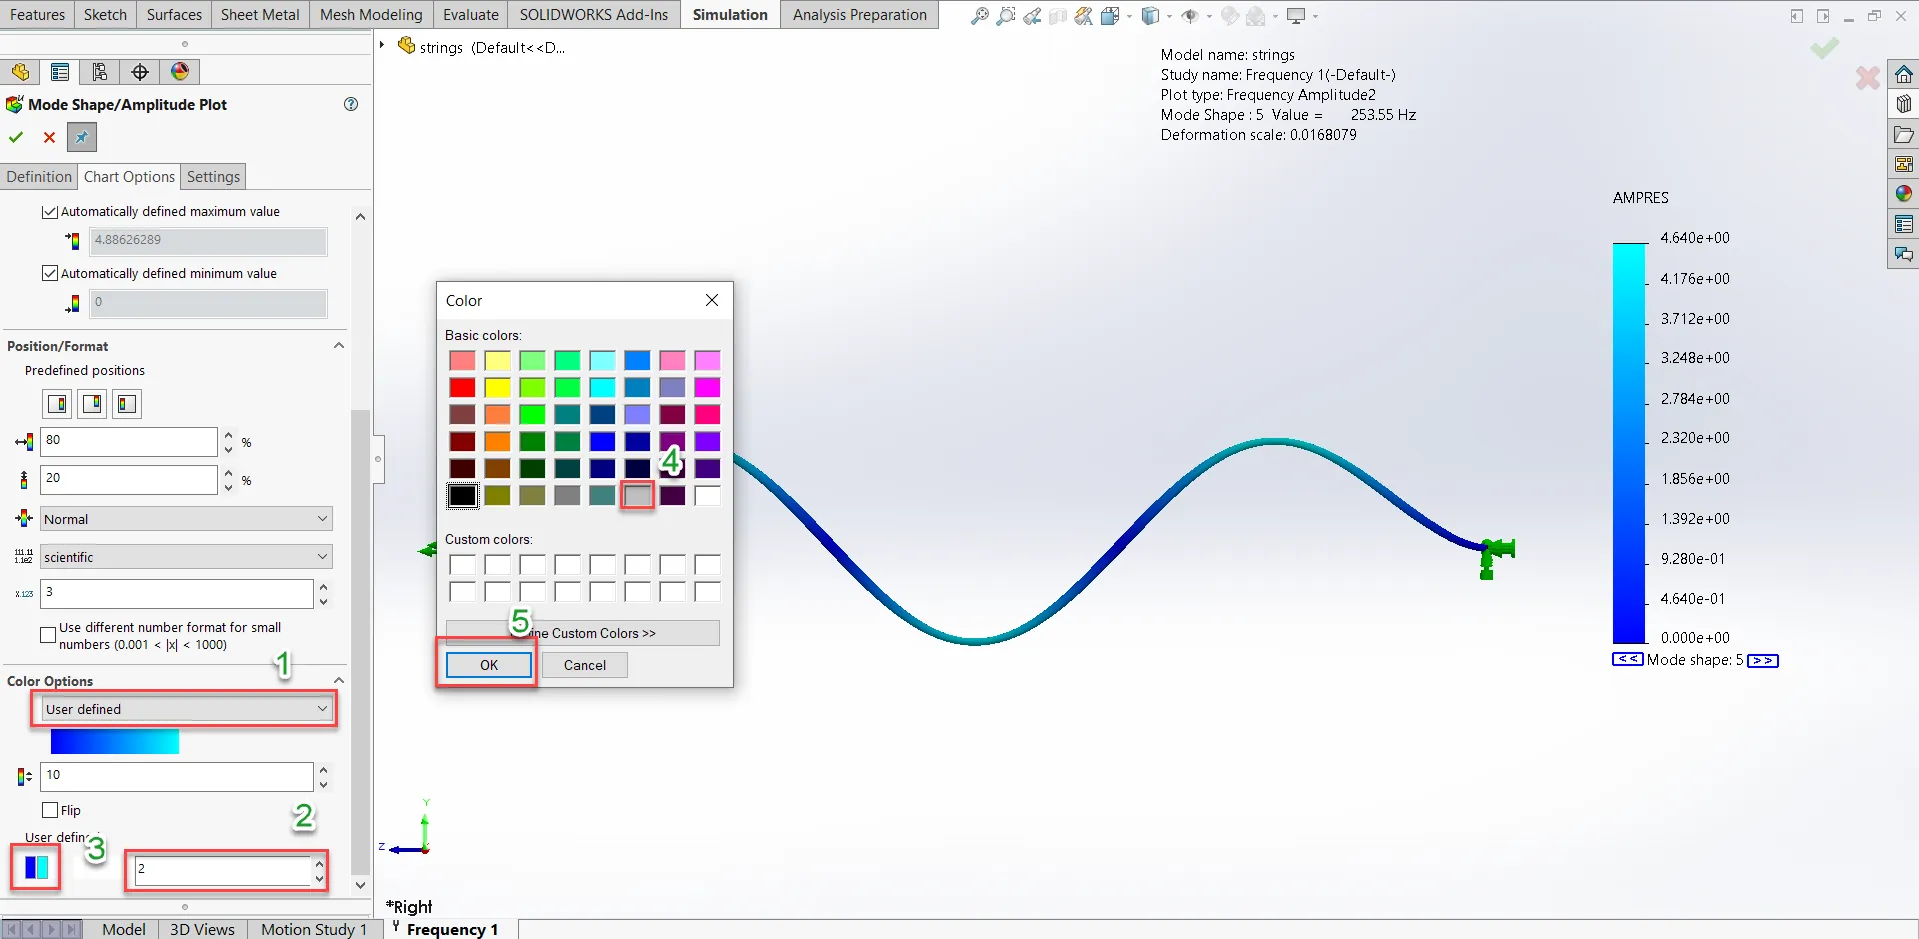
Steps to change the color options from a colored to a colorless plot manually
In this tab, expand the Color Options category. Change from the default color options to the user-defined color options like in the screenshot above. Next, change the number of colors from the default amount of five to two. Then click on one of the two colors and change it to gray and press OK. Lastly, click on the other color available and change it to the same color of gray.
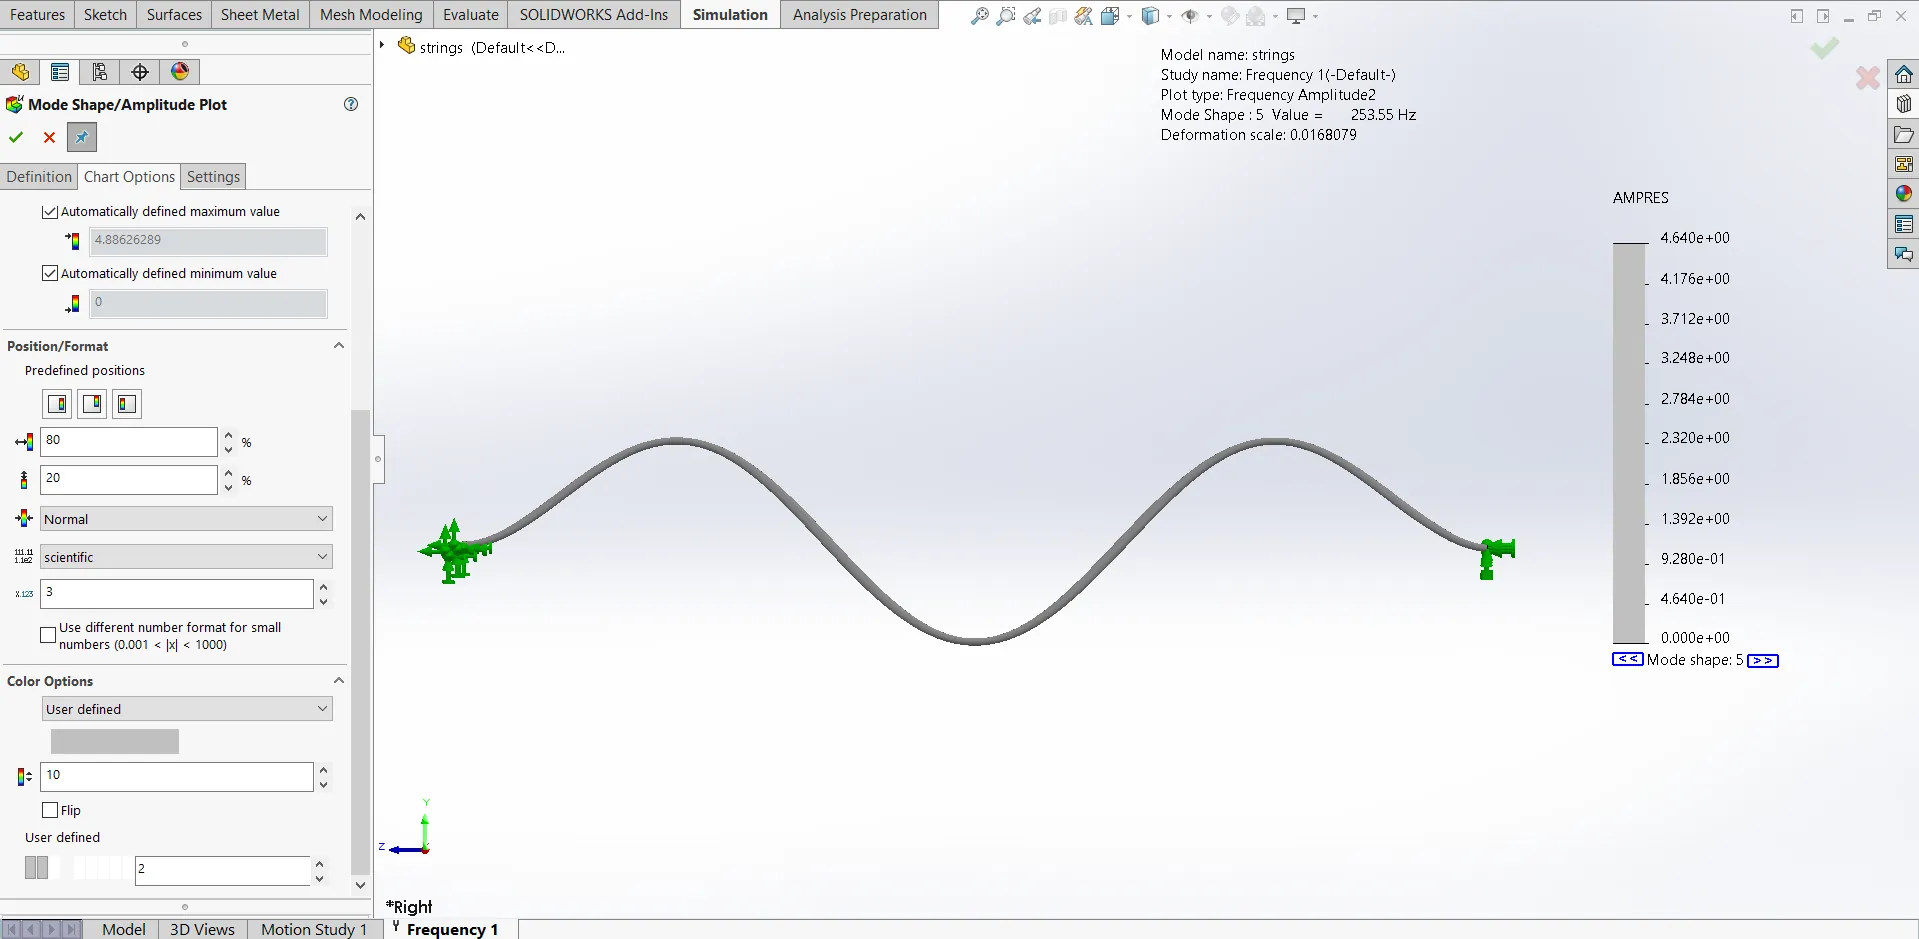
Mode Shape plot showing gray colors after a manual change
After performing these steps, the user will be able to see a colorless mode shape plot while keeping the plot chart and keeping the ability to use the two double carrot blue buttons to easily switch between the different mode shapes all of which will be colorless as seen in the screenshot below.
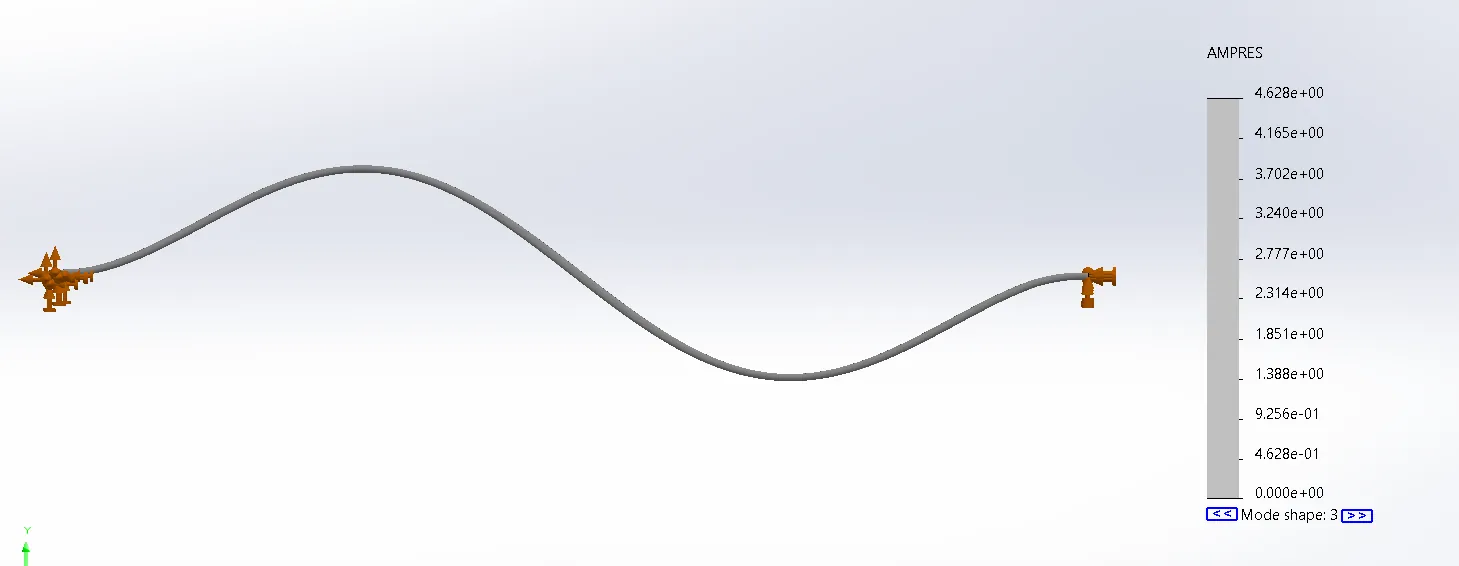
Colorless mode shape plot with the two double carrot blue buttons available to easily change the plot to a differet mode shape

About Taran Packer
Taran is a SOLIDWORKS Simulation Technical Support Specialist at GoEngineer. He has a Bachelor’s degree in Biomedical Engineering from the University of Utah. Taran enjoys learning about different tools in SOLIDWORKS Simulation, Flow Simulation, and Plastics.
Get our wide array of technical resources delivered right to your inbox.
Unsubscribe at any time.