How Do I Know My Mesh Is Good Enough?
Strictly speaking, there is no rigorous way of knowing for sure that the mesh you have chosen yields a good result, but the following techniques are some of the most popular ways that I have come across for building significant confidence that it’s adequate and reliable.
1) Manually Change the Mesh Size with Mesh Control
This method is probably the most straightforward and popular method. Users can test for mesh convergence by making changes to it using a mesh control seen below:
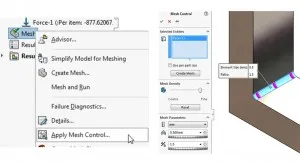
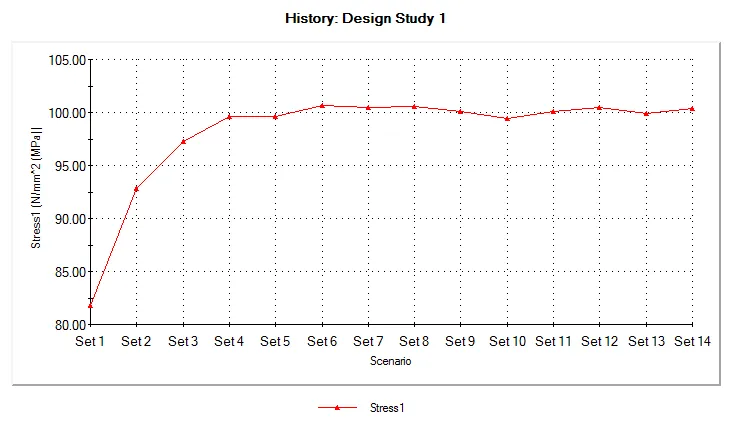
You can even set up a design study to test different sizes
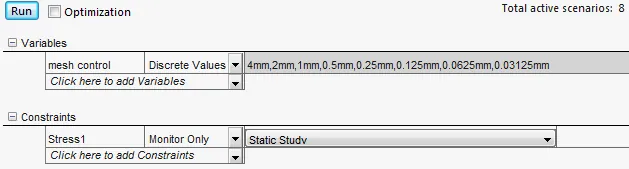
and produce a graph like the one shown below to verify that the results stabilize (in this case around 100 MPa):
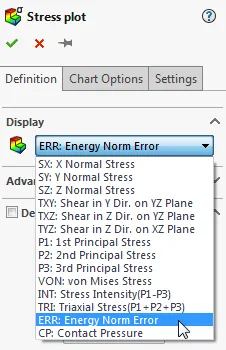
2) Plot Energy Norm Error
You can use “Energy Norm Error” plots to pinpoint regions that are not converged. This type of plot can be found in the “Stress plot” Property Manager:
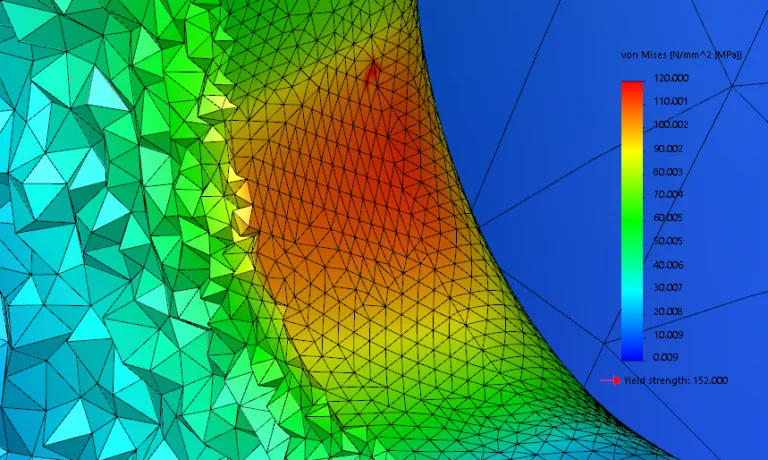
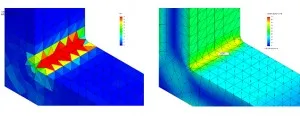
The following graphics show a coarse mesh with high energy norm error (left; average = 48%) and the associated stress results (right; max = 82.2 MPa):
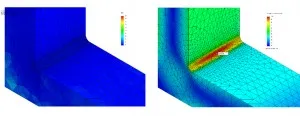
Compare this to a scenario with a fine mesh with low energy norm error (left; average = 0.3%) and respective stresses (max = 100 MPa):
More details on energy norm error are shown here, where it states:
3) Adaptive Meshing

Adaptive meshing can be turned on for certain models by going to the study properties shown here:
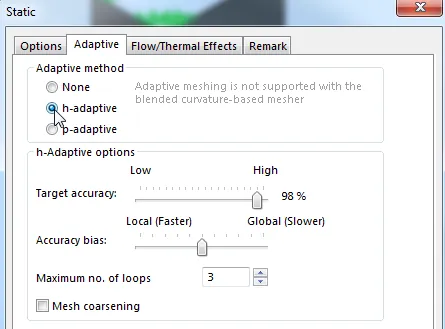
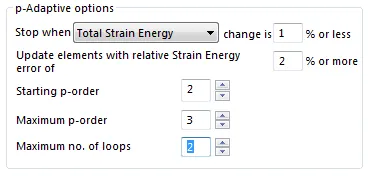
The h-adaptive option tends to be more popular since it visually splits elements wherever there are large norm errors. There is no local option for this method, so it can be computationally expensive to run this for many loops. The P-adaptive method is also handy as a convergence check tool, where you may set it to run two loops with the following settings:
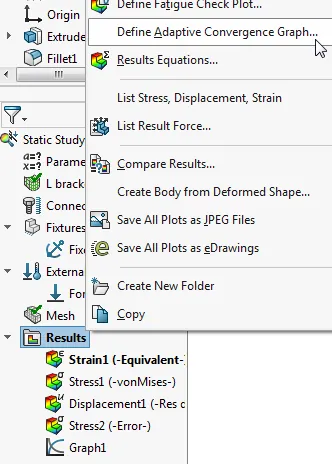
After running both loops, you should generate an adaptive convergence graph by using the option below:
A poor mesh (left) and a good mesh (right) might generate graphs like you see below:
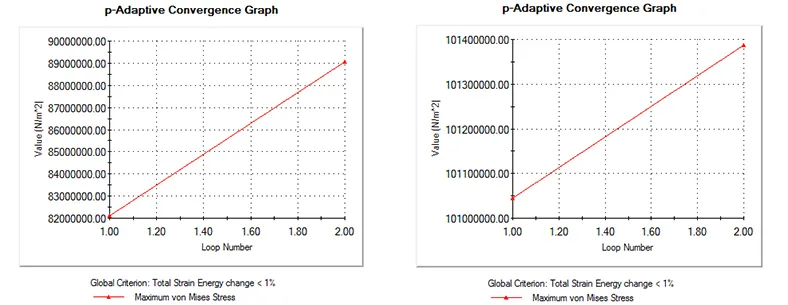
If you think these graphs looks similar… LOOK AGAIN! The actual values on the y-axis tell the story of how a slight change in the mesh p-order can produce a large change in the results which tells me the one I used to create the graph on the left is dubious.
There are a variety of other tools available to check mesh quality, but the methods above seem to be the most popular.

About Shaun Bentley
Shaun Bentley is passionate about applied mathematics and engineering, which led him to pursue and understand real world applications of FEA, CFD, kinematics, dynamics, and 3D & 2D modeling. He teaches many simulation classes to both new and advanced users attending training at GoEngineer. Since 2006, Shaun has been working with simulation tools to solve real world engineering problems. With every new project, he seeks to find ways to push simulation to its uppermost limits, even going so far as to write bespoke code and macros. He has passed the Michigan FE exam and mentors or consults for virtually any industry that uses SOLIDWORKS, especially automotive and automated tools. He is a speed 3D modeling champion and one of the first Certified SOLIDWORKS Experts in Simulation in the world.
Get our wide array of technical resources delivered right to your inbox.
Unsubscribe at any time.