Investigating Continuity and Curvature in SOLIDWORKS (Part 3)
In part 1 and part 2 of this series, we discussed the definitions of continuity in sketches and surfaces. This included C-0 (contact), C-1 (tangent), and C-2 (curvature) continuity in both 2-dimensional and 3-dimensional scenarios. When striving to create a certain type of continuity, it is often important that we confirm its presence. There are many methods and tools we use to analyze our parts and understand their surface continuity inside of SOLIDWORKS. In this article , we will discuss edge continuity, Deviation Analysis, Curvature Display, and Zebra Stripes.
Edge Continuity
If you remember from part 1 of this series, C-0 (contact) continuity is simply accomplished when one entity starts where the other ended. Because our surfaces are bounded by edges, this means in order for two surfaces to have C-0 continuity, they will need to share a common edge. By looking at the color of our edges and using the check tool, we can analyze whether our surfaces are contact continuous.
Edge Color
When two surfaces share a common edge, that edge is then displayed as black. If the edge of a surface is not connected to another surface, it will be displayed as blue. This is would be a situation exhibiting discontinuity (though in some cases it can be solved by simply knitting the surfaces together).
Discontinuous surfaces showing blue edges Continuous surfaces showing black edges
Check Tool
When working with surfaces, it can often be difficult to find out where the surfaces are still open. Running the Check tool (Tools > Check, or Check on the Evaluate tab of the CommandManager) will let us know how many open surfaces we have and point to each of them with a yellow arrow.
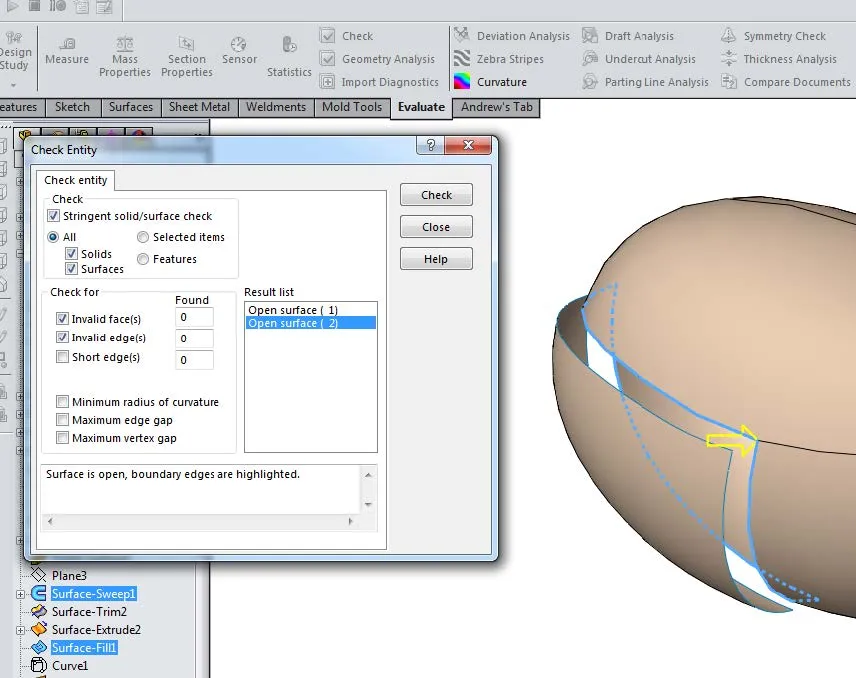
Check tool showing open surfaces
Deviation Analysis
The interface where two surfaces meet is referred to as an edge, and it is along these edges that we can analyze the continuity between the surfaces. In SOLIDWORKS there is a tool called Deviation Analysis (Tools > Deviation Analysis or CommandManager: Evaluate > Deviation Analysis) that we can use to gain an understanding of the angle between the surfaces. Once you have opened the Deviation Analysis tool, select the two surfaces of interest, and click Calculate. This serves as an effective way to test for C-1 (tangent) continuity, as C-1 requires a continuous trajectory between the entities involved. The readout will provide you with a min/max/average deviation angle between the faces that meet at the selected edge. For C-1 continuity, you will want all three values to be zero (or very close).
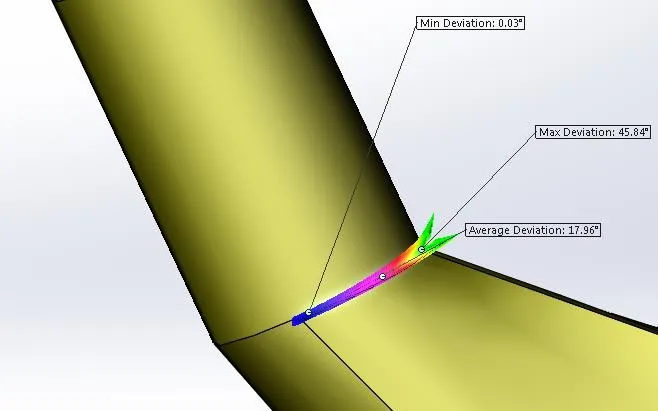
C-0 Continuity
Min Deviation: 0.02 deg
Avg Deviation: 17.96 deg
Max Devation: 45.84 deg
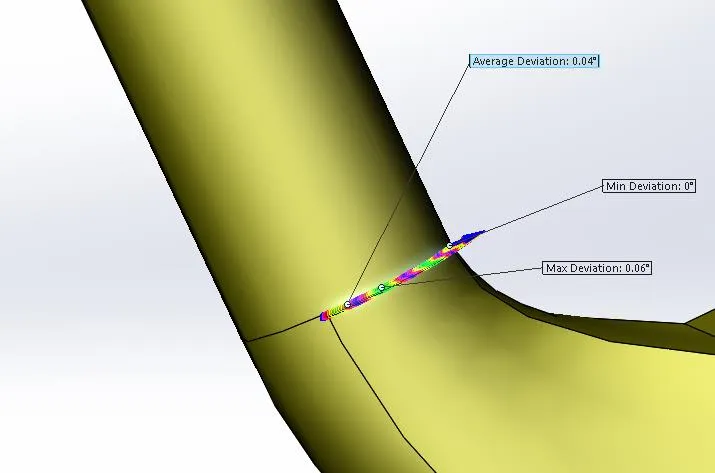
C-1 Continuity
Min Deviation: 0 deg
Avg Deviation: 0.04 deg
Max Deviation: 0.06 deg
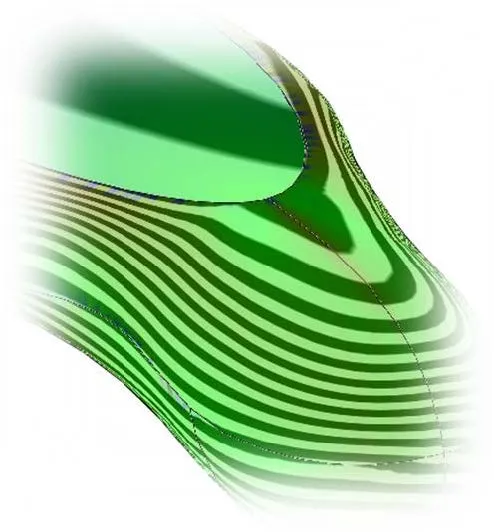
Curvature Display
As discussed in Part 2 of this series, 3-dimensional curvature is related to the spherical radius of the surface. The Curvature Display tool (View > Display > Curvature, or CommandManager: Evaluate > Curvature) paints our surfaces displaying colors correlated to the surfaces’ local spherical curvature. This tool can help us confirm C-2 continuity between surfaces. When C-2 continuity is present, we will see the colors at an edge change in a smooth gradient. If there is a stark change between colors at the edge, we are seeing either C-0 or C-1 continuity.
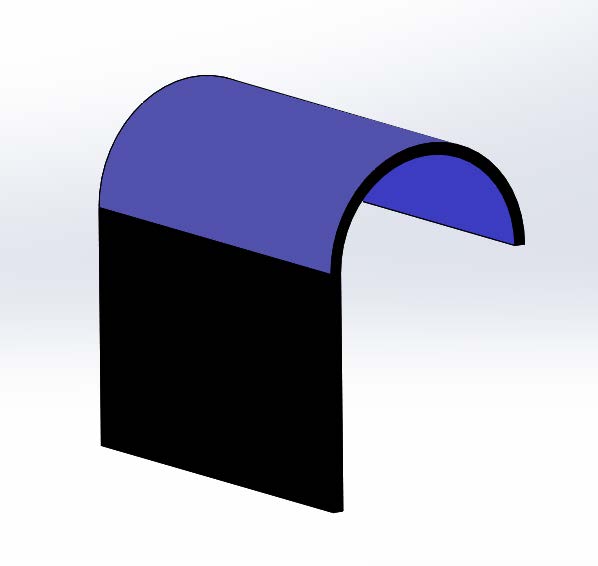
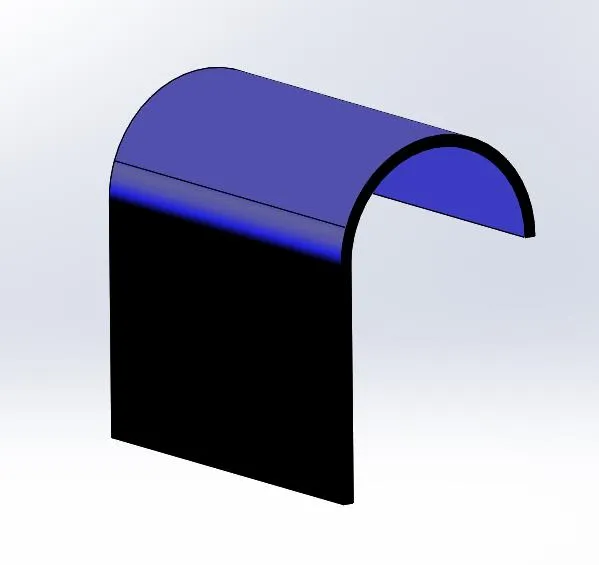
C-1 surfaces exhibiting stark change in curvature C-2 surfaces exhibiting gradient of curvature
Note: If you are finding that the color range is not appropriate for the curvature range present in your part, you can change the color range by clicking on the Curvature button inside of the Model Display section of the Document Properties.
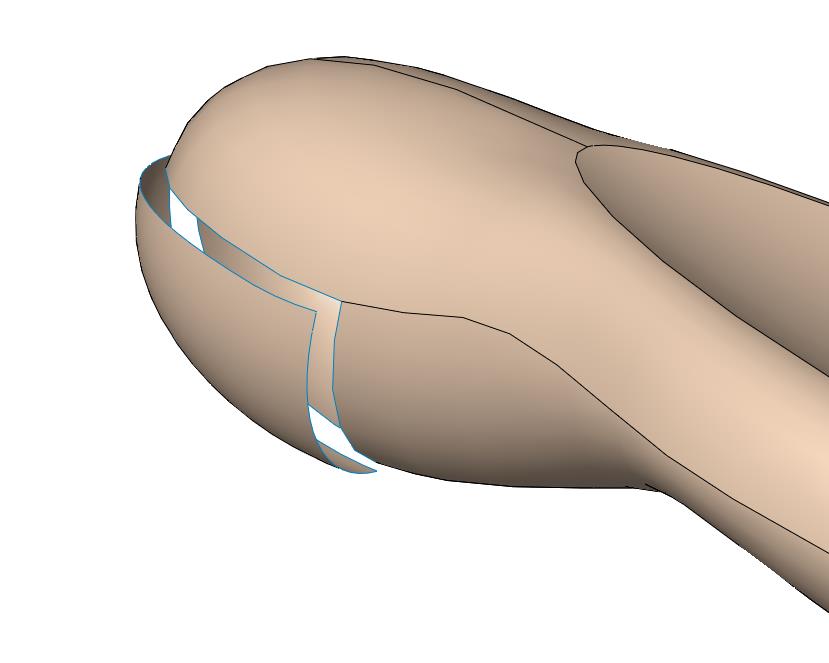
Zebra Stripes
One of the most comprehensive tools for investigating continuity is the Zebra Stripes tool (View > Display > Zebra Stripes, or CommandManager: Evaluate > Zebra Stripes). This tool can be used to identify C-0, C-1, and C-2 continuity. The following images show how the Zebra Stripes will appear for each of these continuity conditions.
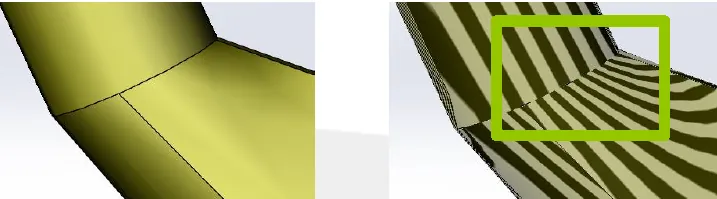
C-0 Continuity
Zebra stripes do not match at the boundary
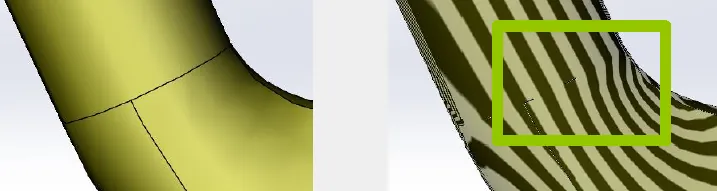
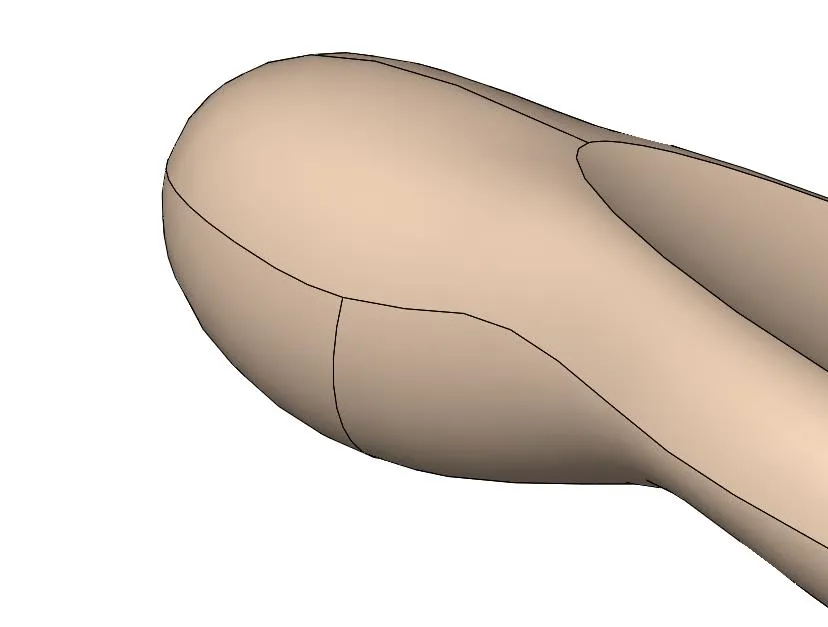
C-1 Continuity
Zebra stripes match but have sharp corners at the boundary
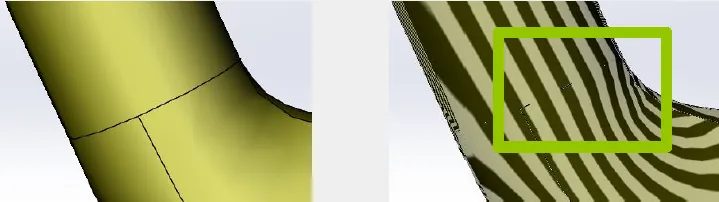
C-2 Continuity
Zebra stripes match at the boundary and have smooth transitions on each side of the boundary.
You may notice that the zebra stripes display as an order below the continuity order they are applied to – emulating the way a reflection would appear on your part. This is a good concept to remember when trying to keep track of how each type of continuity appears in the Zebra Stripes mode.
Summary
When designing parts, having an awareness of their continuity and curvature enhances our ability to design as we intend to. From mitigating stress concentration by ensuring C-1 continuity between faces to creating smooth form factors with C-2 continuity, these concepts are extremely relevant to many common design goals.
Using the edge continuity tools, Deviation Analysis, Curvature Display, and Zebra Stripes, you will be able to visualize the continuity and curvature present inside of your models. Whether you are aiming for ergonomic smoothness in your consumer products or nice-looking reflections on a clearcoat, investigating the continuity conditions is extremely important – and the tools described in this document are what you will use to do so.
Related Articles
How to Use the Import Diagnostic Tool in SOLIDWORKS
How to Remove the SOLIDWORKS Toolbox Flag
SOLIDWORKS Pack and Go VS. Copy Tree
![]()
About GoEngineer
GoEngineer delivers software, technology, and expertise that enable companies to unlock design innovation and deliver better products faster. With more than 40 years of experience and tens of thousands of customers in high tech, medical, machine design, energy and other industries, GoEngineer provides best-in-class design solutions from SOLIDWORKS CAD, Stratasys 3D printing, Creaform & Artec 3D scanning, CAMWorks, PLM, and more
Get our wide array of technical resources delivered right to your inbox.
Unsubscribe at any time.