SOLIDWORKS 2020 Flow Simulation Fan Derating – New!
SOLIDWORKS 2020 Flow Simulation: Cool Your Jets with Fan Derating

Fans can operate at different speeds. In order to slow down a fan in Flow Simulation 2019 and prior, you would have to manually adjust their fan curve using a spreadsheet.
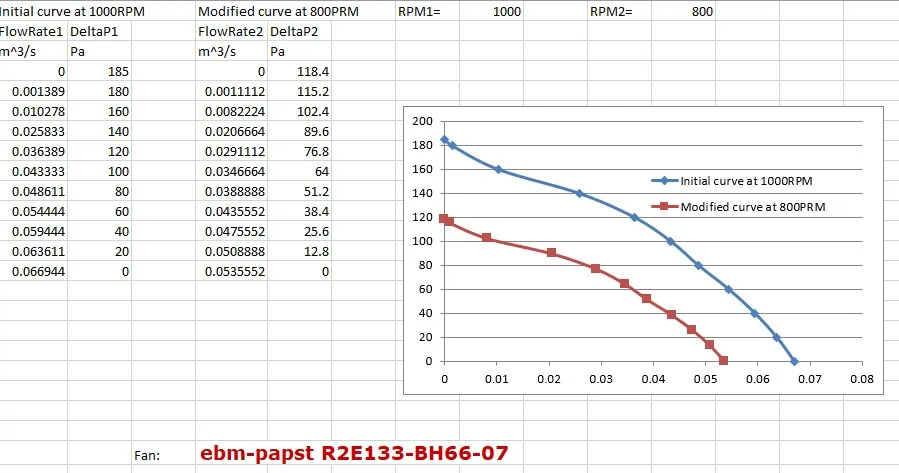
Figure 1 – Spreadsheet method for derating fans in Flow 2019 and prior (S-066832)
Now in SOLIDWORKS Flow Simulation 2020, you can view and adjust their fan curve directly in the Fans PropertyManager. See the derating curves for values between 0 to 1 in the figure below.
Figure 2 – Animation showing derating curves
Relationship between derating value and fan curve
If you look carefully, the relationship between the derating value and the fan curve is simple:
- Pressures scale down with the square of the derating value
- Volume flow rates scale down linearly
In other words, a derating value of ½ (0.5) will lower pressures on the curve to ¼ and volume flow rates by ½.
Of course, running simulations with different fan speeds can have a big impact on your results. The animation in Figure 3 shows results of simulations performed with fan deratings from 0 to 1 as well.
Figure 3 – Animation showing results from different fan speeds
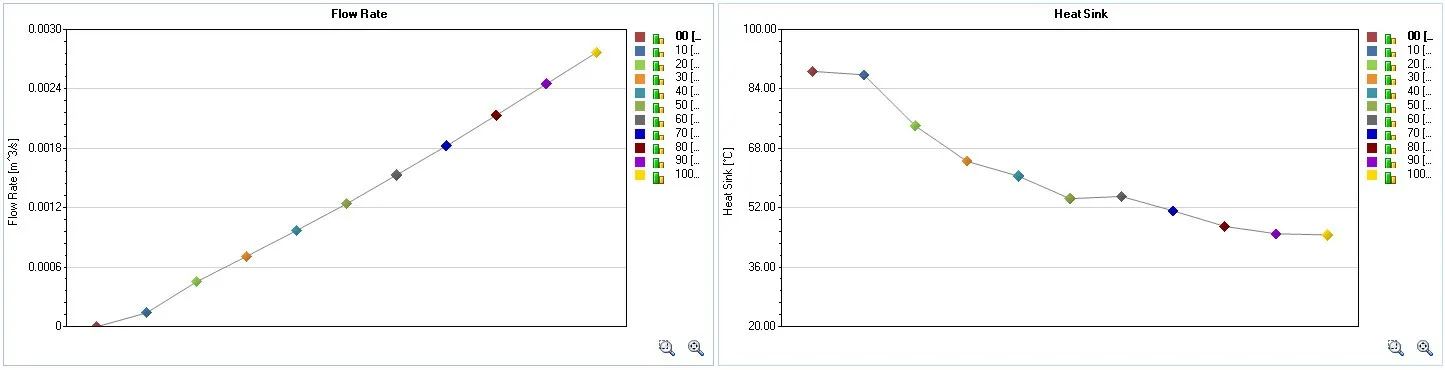
Figure 4 – Derating Flow rates and temperatures for values of 0 to 1
In this case, there was a nearly perfect linear relationship between the derating value and the Flow Rate (Figure 4; left) which might mean I was running near the maximum flow region of the fan curve for most of these studies. Also, having no fan gave me nearly equal temperatures as having a fan derated to only 10% (figure 4; right). Of course, as expected, cooling performance went up dramatically with fan speed.
The actual operating point of the fan (pressure and flow rate) can be displayed on the derating curve.
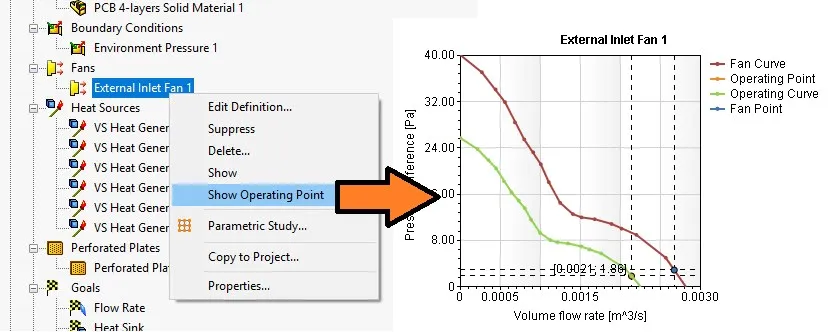
Figure 5 – Operating point for a 0.8 derating curve
Now in Flow Simulation 2020, you can slow your fans down without slowing down your design process!
Interested in learning more about what’s new in SOLIDWORKS 2020, check out our collection of videos here.

About Shaun Bentley
Shaun Bentley is passionate about applied mathematics and engineering, which led him to pursue and understand real world applications of FEA, CFD, kinematics, dynamics, and 3D & 2D modeling. He teaches many simulation classes to both new and advanced users attending training at GoEngineer. Since 2006, Shaun has been working with simulation tools to solve real world engineering problems. With every new project, he seeks to find ways to push simulation to its uppermost limits, even going so far as to write bespoke code and macros. He has passed the Michigan FE exam and mentors or consults for virtually any industry that uses SOLIDWORKS, especially automotive and automated tools. He is a speed 3D modeling champion and one of the first Certified SOLIDWORKS Experts in Simulation in the world.
Get our wide array of technical resources delivered right to your inbox.
Unsubscribe at any time.