SOLIDWORKS Simulation Frequency Analysis Comparison Between FEA and Real Life
A common question with Finite Element Analysis is how reliable are the results that it produces or how well do the results relate to the behavior of the final product. In this article, the natural frequencies of a modeled bell will be compared to the measured frequencies of the real-life counterpart using SOLIDWORKS Simulation.
Setup
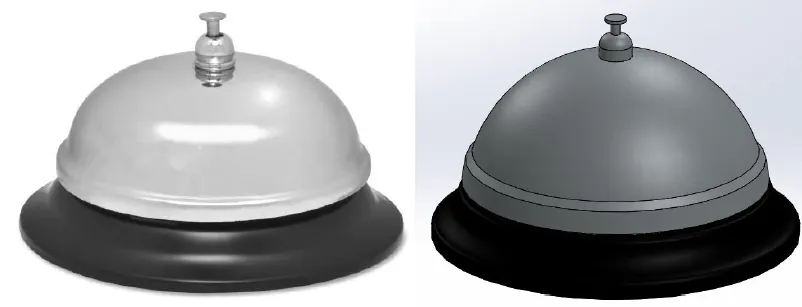
A desk call bell was used to take specific measurements to construct the 3D model of the bell similar to as shown below.
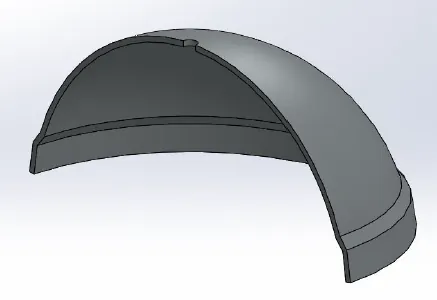
The theoretical study of the bell’s natural frequencies assumes that the bell resonates freely as the real-life counterpart is not rigidly fastened to the mount. Material properties for Chrome Steel were applied to the bell and the program specified to return 16 natural frequencies. As this is an unrestrained frequency analysis the first 6 frequencies are expected to be near 0 Hz with the first natural frequency appearing as the 7th mode shape. The analysis analyzes only the bell body itself and none of the mounting as seen below.
FEA Results
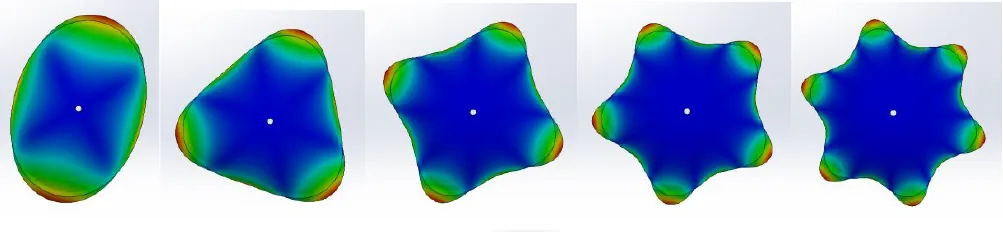
The results of this analysis reveal expected mode shapes for the first five mode shapes for non-rigid body motion frequencies. Top-down views of these mode shapes describe how modes appear.
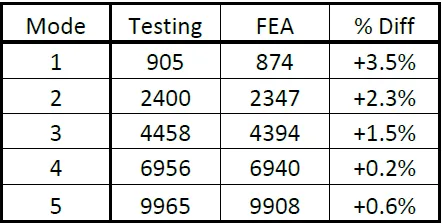
The resulting natural frequencies reported from the FEA analysis are as follows:
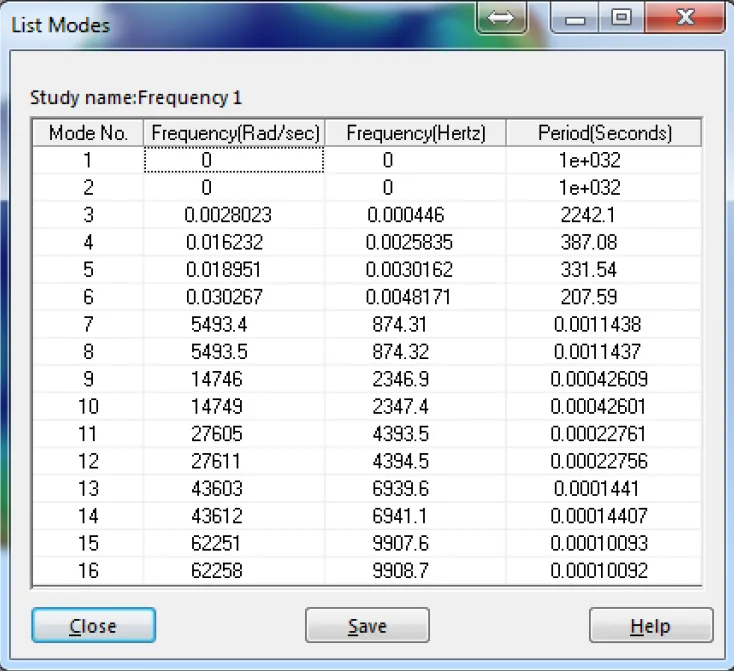
Given that the first six are the result of rigid body motions and that each successive pair of modes are then duplicates, the final results are:
1st Mode = 874 Hz
2nd Mode = 2347 Hz
3rd Mode = 4394 Hz
4th Mode = 6940 Hz
5th Mode = 9908 Hz
Real-Life Spectrum Analysis Results
The real-life testing was done via a smartphone application named SpecScope. The physical bell was isolated in a silent room and rung to collect data via the spectrum analysis tool.
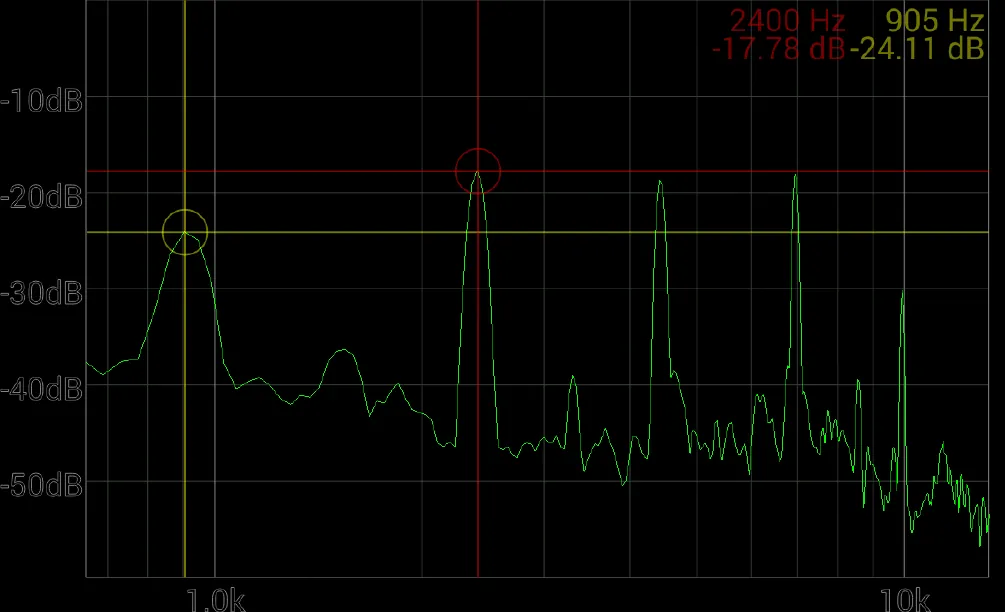
The frequencies measured at the peaks shown in the above response graph are as follows:
1st Mode = 905 Hz
2nd Mode = 2400 Hz
3rd Mode = 4458 Hz
4th Mode = 6956 Hz
5th Mode = 9965 Hz
Result Comparison
Across the first five resonate modes of the bell, the difference between measured frequencies and calculated frequencies does not exceed 4% with better accuracy for higher mode frequencies. This modeled bell could be considered an accurate approximation of the real-life counterpart.

About Ryan Dark
Ryan has been in the GoEngineer technical support team since February 2008 where he most notably provides support for all FEA and CFD software offered by SolidWorks. His most recent accolade is the title of Elite Application Engineer awarded by SolidWorks Corp.
Get our wide array of technical resources delivered right to your inbox.
Unsubscribe at any time.