Manifold Optimization with SOLIDWORKS Flow Simulation – Part 1
The automotive world is filled with engineers who are constantly trying to improve the performance of their vehicles by swapping out their stock parts with custom designs. This can be a tedious and expensive process if you are attempting a new design that hasn’t been field-tested. With GoEngineer, we have software tools that address this bottleneck with design simulation; in this article, we use SOLIDWORKS Flow Simulation to analyze and improve the performance of an intake manifold with Computational Fluid Dynamics.
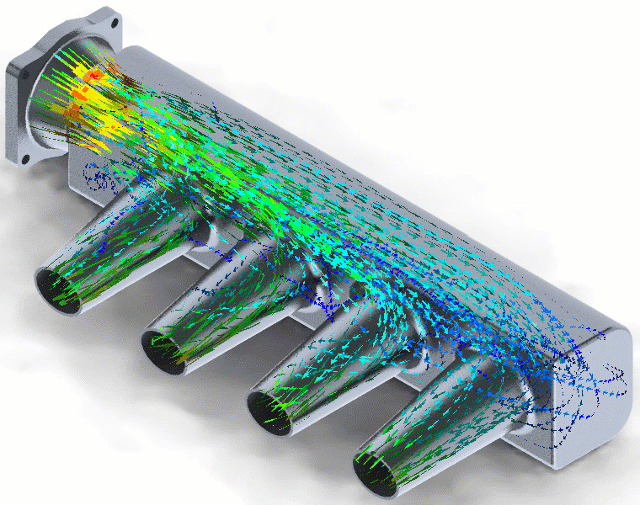
Figure 1: Airflow trajectory plot through intake manifold
The Basics
The basic function of an intake manifold is to deliver air to the cylinder head of an engine and good intake manifolds ensure that the air is distributed uniformly between the intake ports of these cylinders. The intake manifold has two main components to achieve this – the Plenum (A) and Runners (B).
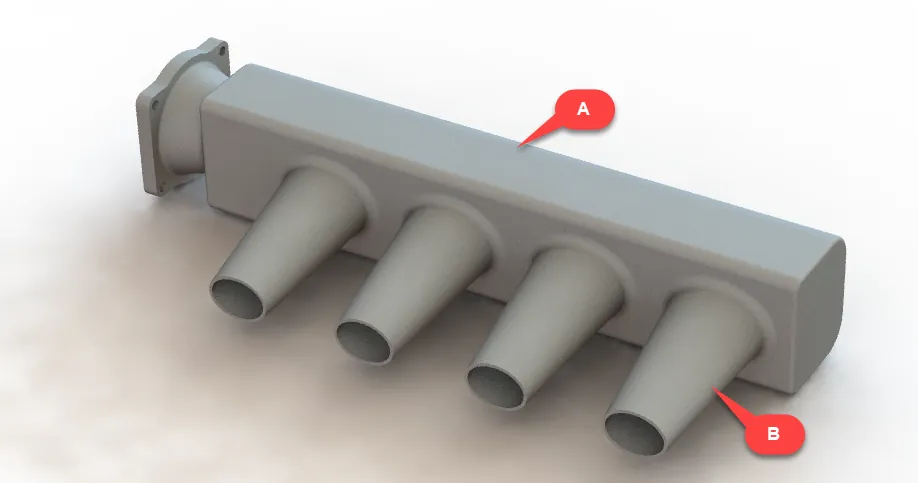
Figure 2: Picture of baseline intake manifold design
I modeled up the manifold (Figure 2) with SOLIDWORKS for the CFD analysis. It was designed to test the performance of a fundamental shape to ensure that this design could be improved. With SOLIDWORKS Flow Simulation, the analysis setup is a simple process and involves dialing in just a few things:
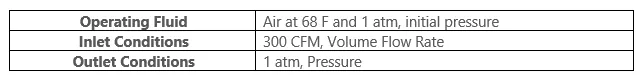
Table 1: Boundary Conditions for Analysis
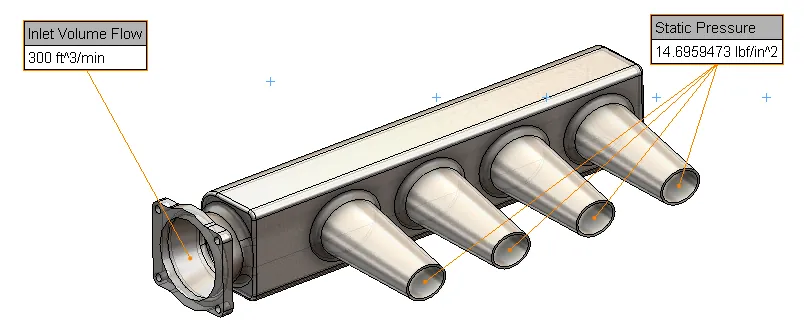
Figure 3: SOLIDWORKS Flow Simulation setup
We chose 300 CFM as the inlet flow rate which is typical for a 4-cylinder intake manifold. The air is at standard temperature and pressure (STP) and we set the outlet to open atmosphere as we are interested in just analyzing the manifold and not the entire engine.
Preliminary Design Results
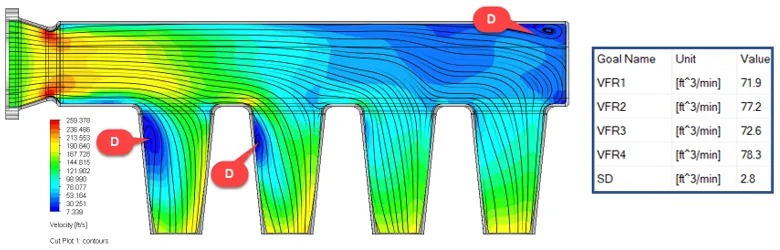
Figure 4: Results from Flow Simulation – Velocity Cut Plot (Left), Goal Table (Right)
We used 2 results to study the performance of the manifold – A cut plot of the air velocity through the manifold and a Goal Table for the Volume Flow Rates (VFR) through the runners. From these results, there are a few things we can establish:
- The goal table indicates that the runners aren’t balanced with a Standard Deviation (SD) of 3 CFM! While the 4th runner operates at 78 CFM, the 1st runner operates at 71 CFM.
- The manifold shape is also not optimized for airflow as evidenced by the recirculation areas (D) from the velocity cut plot.
It is important to note here that I used ‘Standard Deviation’ to measure the air distribution between the runners. The Standard Deviation is a convenient statistic that keeps track of how far a set of values diverge from their mean value (In our case, the mean flow rate is 75 CFM since the 300 CFM inlet flowrate is distributed across 4 runners). It is essential to keep this number as close to 0 CFM as possible for a good design. This called for major design improvement.
Design Mod – Dual Plenum Manifold
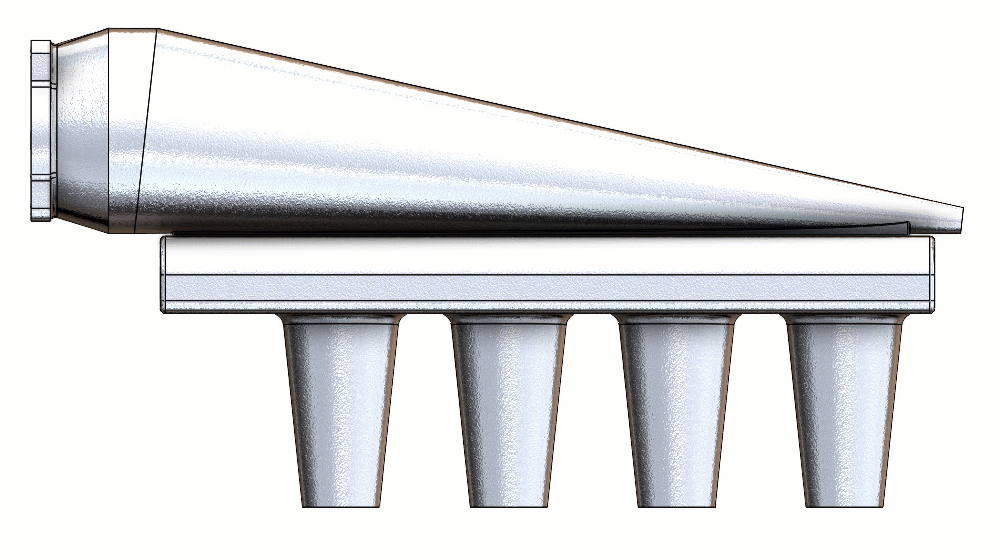
Figure 5: Dual Plenum Manifold design variations
To improve airflow and distribution, I decided to go with a ‘Dual Plenum’ intake manifold design. I essentially put a conical plenum (‘A’ in Figure 6) over the initial box-shaped plenum (B) leading into the runners.
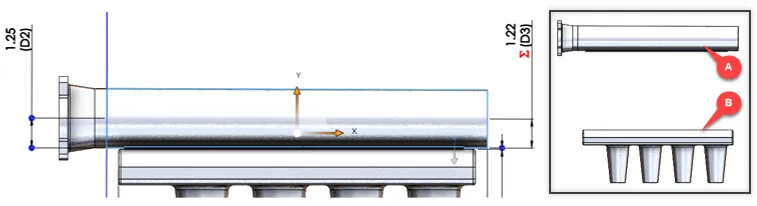
Figure 6: Design variables for Plenum A (Left); Plenum A and B split (Right)
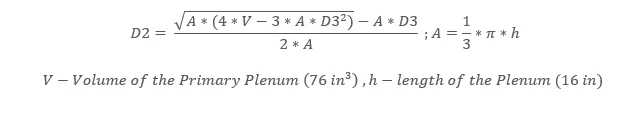
To drive the entire design with just one variable, I decided to keep the volume of the conical plenum constant (about 1 liter). This enabled me to manipulate its shape with just the Major Radius (D2) which drives the Minor Radius of the plenum (D3). I achieved this by plugging in the following equation in SOLIDWORKS relating the radii:
This set my design objective: What Major Radius of the cone-shaped plenum will yield the most uniform air-flow distribution?
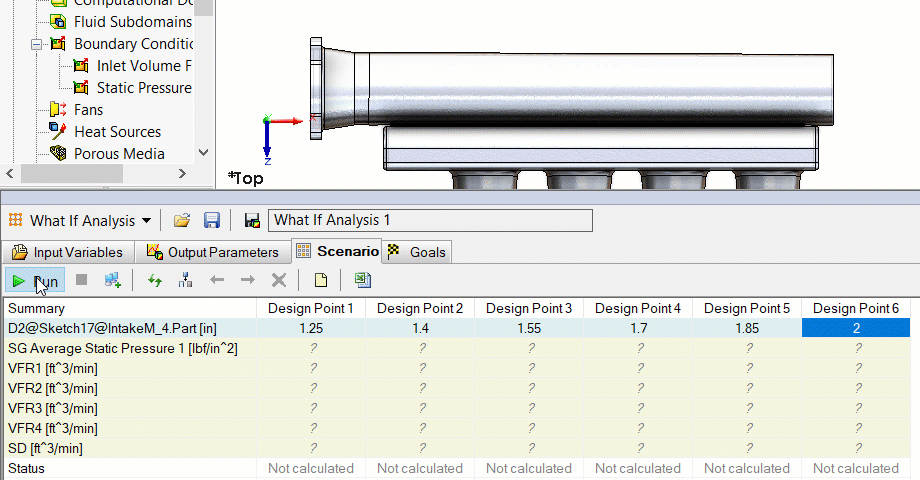
Figure 7: Parametric Study Table in action
To answer this question I used the Parametric Study tool available in SOLIDWORKS Flow Simulation (Figure 7). This performs the CFD analysis on a user-defined range of geometric and process parameters for design exploration and optimization. Row 1 lists the dimension name and the values for the Major Radius of the plenum that was tested based on the maximum (2”) and minimum (1.25”) limits. I was able to determine the best shape for the manifold by recording the Standard Deviation for each design step. In our case, this would be the design listed in the last column with the 2” Major radius that showed a Standard Deviation of 1 CFM.
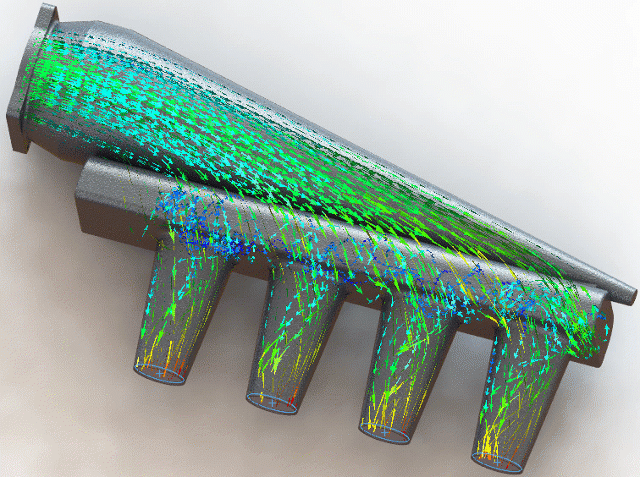
Figure 8: Air Flow Trajectory animation through optimized manifold
While we established the efficiency of the airflow distribution through the Standard Deviation parameter, we will still need to ensure that the manifold volume is being optimally utilized. This is evidenced by the airflow trajectory plots in Flow Simulation. This plot shows that the flow through the primary plenum is uniform, free of any localized accelerations and dead spots.
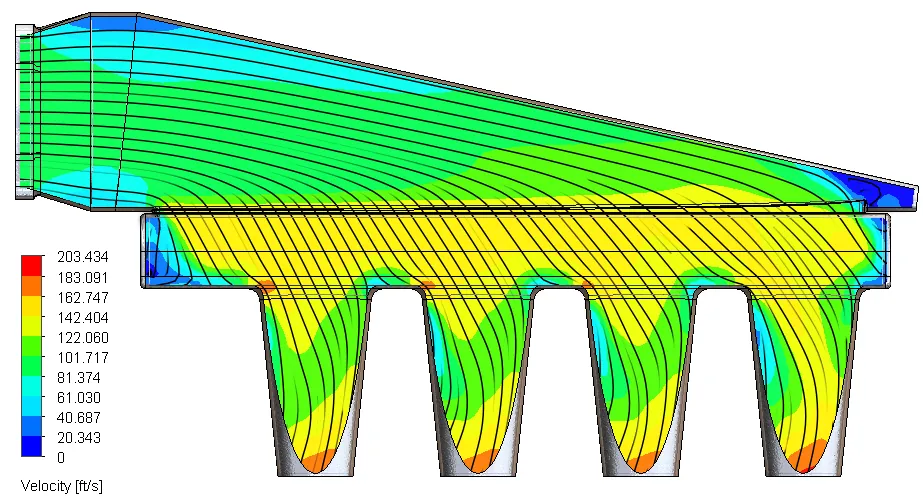
Besides a small portion at the nose of the plenum, the velocity cut plot also indicates this flow uniformity through the manifold and runners, free of any recirculation areas.
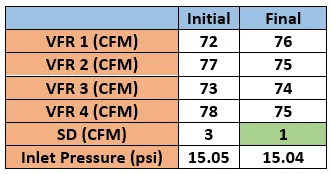
Here is a table comparing the results between the boxed design and the dual-plenum design. There was a major improvement in the airflow through the first runner with the design change.
Summary
Using SOLIDWORKS Flow Simulation, we were able to redesign the box-shaped manifold to improve air-flow performance. We took advantage of the Parametric study tool to simplify and automate the design iteration process, enabling users to find optimum operating points with minimal user intervention.
Many thanks to Jeff Jordan, our Electrical & PCB Product Manager for his ideas, guidance, and automotive know-how. He is helping revolutionize the way engineers think and design products. Check out one of his articles covering reverse engineering in automotive design.
In this example, we modified just one design parameter, but most engineering situations require balancing multiple parameters to realize a goal. Stay tuned for part 2 of this article where we will take on this new challenge:
Optimizing the intake manifold with multiple design variables!

About Arun Thiraviam
Arunachalam Thiraviam is a Simulation Product Specialist with GoEngineer. He is involved in educating and assisting customers with studying the quality of product design through FEA, CFD and Injection Molding analysis. He has a Master’s Degree in Mechanical Engineering from North Carolina State University where he was involved with studying the Dynamics of floating Vertical Axis Wind Turbines. Besides engineering, he plays the guitar and writes music in his free time.
Get our wide array of technical resources delivered right to your inbox.
Unsubscribe at any time.