Tank Sloshing Using SOLIDWORKS Flow Simulation
The Theory
The tank contains two immiscible and homogenous fluids, like water and air. The interface between the two is called a free surface – a name used by SOLIDWORKS Flow Simulation to refer to the calculation method included in the program.
 Free Surface with Flow Simulation allows users to simulate free surfaces using the Volume of Fluid technique, thus allowing us to track the sloshing of a tank over time. Concepts not included in the calculation are any phase transitions, like the water evaporating into vapor, and any surface tension, like water droplet formation and adhesion. In the small amount of time the majority of the movement takes place, in this scenario less than 10 seconds, evaporation, condensation, droplets, and meniscus formation are considered negligible.
Setup
A baseline design with no baffles is compared against three separate baffle designs. Design 1 and Design 2 have an open surface area of 1830in² and 1980in² respectively. Design three combines both designs, expanding it’s longitudinal surface area for a total open area of 2575in².
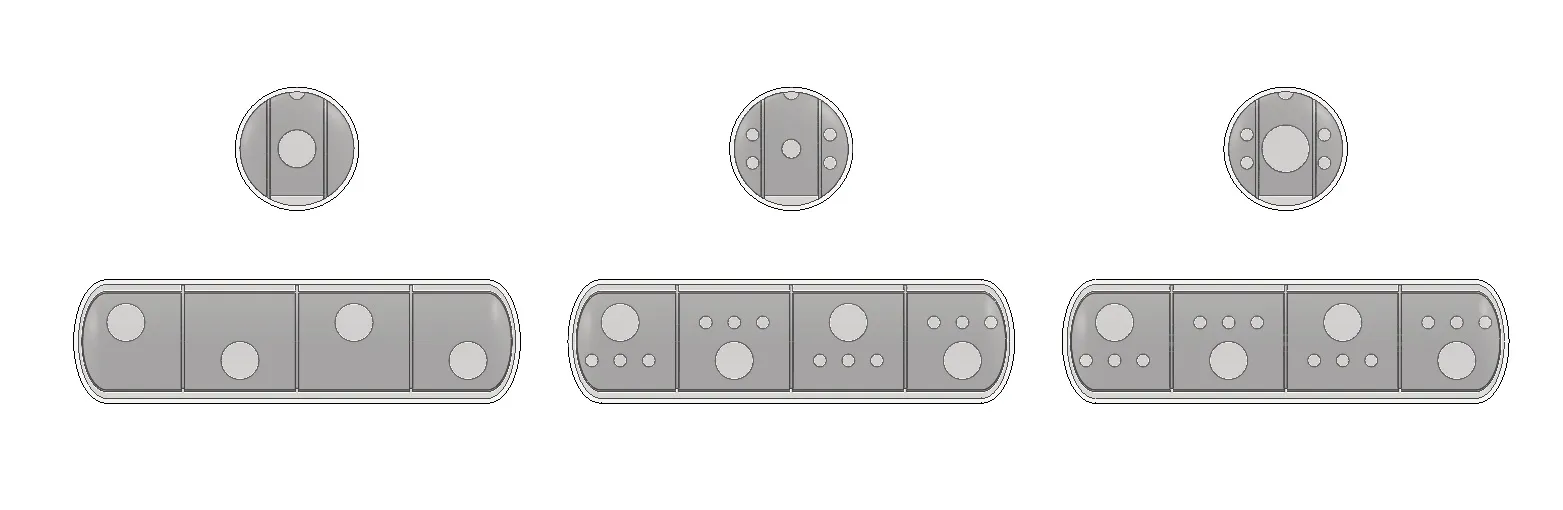
Figure 1. Design 1 (left), Design 2 (middle), Design 3 (right). Potential baffle configurations.
Initial Conditions: The tank is considered to be moving laterally in the +X direction. The initial volume of water laying at the bottom of the tank is about 270 US gallons. The tank is assumed to be filled with water and air.
Analysis: The tank is considered to be positioned horizontally, with gravity pointed in the -Y direction, seen in Figure 2. At time = 0 the tanker begins braking, causing the water to slosh to the right, in the +X direction. Braking is simulated with an acceleration curve in the +X direction, seen in Table 1. The g load is applied over 4 seconds, peaking at 0.5g’s – a common g loading for the average driver. The analysis is run for 10 seconds so we can watch loads under braking, and how long it takes for the water in the tank to settle.
Tracked Results: Average turbulent energy, forces in X, Y, and Z direction, and torques in the X, Y, and Z direction are tracked over time. Using these results, we will determine which baffle design settles the water the fastest, and produces the least reaction forces on the tank, and thus the rest of the tanker.
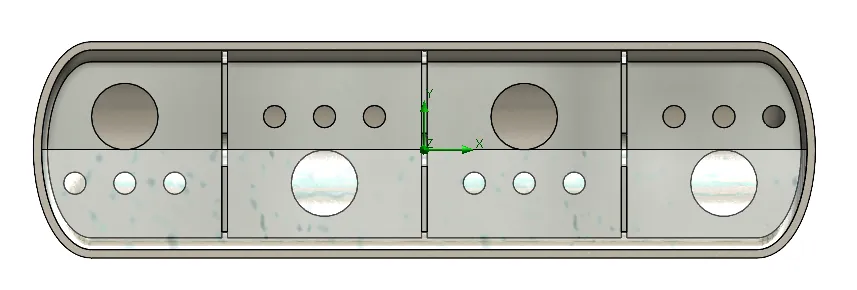
Figure 2. Gravity is in -Y direction, and direction of motion is in +X direction. Positive Torque (Z) is counterclockwise.
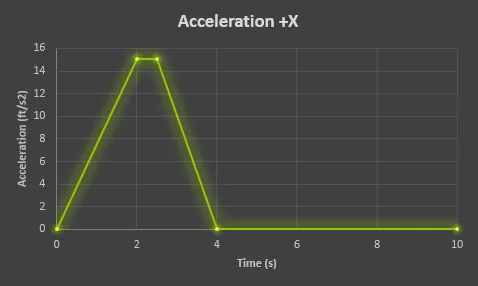
Table 1. Acceleration in +X direction over time.
Tank Sloshing CFD Results
Visually comparing the animations, we see a longer settling time for the baseline, but force and torque loads are difficult to estimate.
Numerical results give us a better way to compare reaction loads and turbulent energy. Every five data points have been averaged together to smooth out spikes. In Table 2, forces damp out faster in the baffle designs. All three baffle designs produce similar force results, with a lower peak load than the baseline.
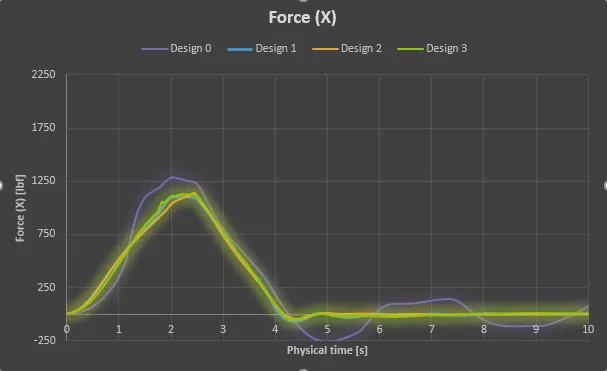
Table 2. Force X direction over time.
To further interrogate which design was a better choice, we can view torque around the Z axis, or the pitching moment. Yaw and Roll were far smaller numbers than Pitching moment so will not be discussed here. Table 3 shows the baseline’s peak torque is near 70,000 in-lbf, and all three designs stay beneath. Design 1 has the lowest peak and the fastest reduction to 0 in-lbf. Design 2 has a greater damping than Design 3, due to the smaller open area in the direction of motion.
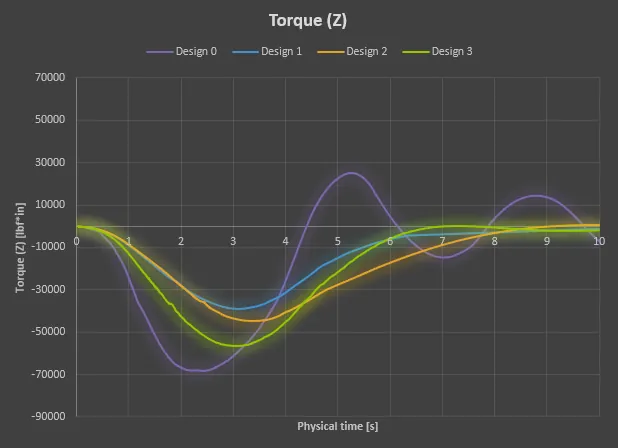
Table 3. Torque (Z), Pitching Moment over time.
Based on these results, we’d consider moving forward with Design 1 into the next phase of design, where the Rolling Moment would be analyzed during a banked curve.
To be certain the final plot, Table 4, shows the bulk average Turbulent Energy over time. Overall peaks are similar across the designs, with Design 3 producing the highest values between 2 an 6 seconds. Design 1 does reach the lowest values over 10 seconds.
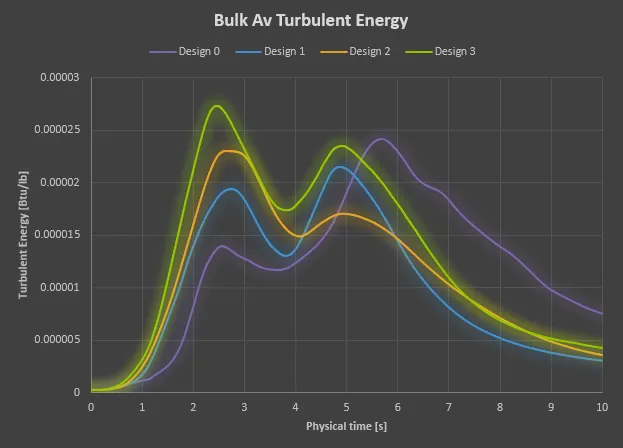
Table 4. Bulk average Turbulent Energy over time.
Ultimately, using SOLIDWORKS Flow Simulation we’re able to use both visual and numerical results to track which baffle design most closely aligns with our design goals.
Which design do you think is the best? And how would you further modify the baffles to reduce the reaction loads on the tank?
If you are curious what SOLIDWORKS Flow Simulation is capable of, need a how-to for analyses that contain multiple phases of fluid, or want a use-case with iterative design and compared results, join us for our upcoming webinar where we’ll discuss this same tank sloshing study.
Related Articles
Introduction to Structural Analysis Using SOLIDWORKS Simulation Tools
Manifold Optimization with SOLIDWORKS Flow Simulation – Part 1
7 Steps to Perform a Fatigue Analysis in SOLIDWORKS Simulation

About Shivani Patel
Shivani has a background in aerospace engineering, and is the Engineering Manager for southern Texas. She has the Elite certification in SOLIDWORKS and is happy to jump into anything in the SOLIDWORKS licenses. Her main specialty is Simulation - and has spent the past 6 years digging into the Motion Analysis, FEA and CFD programs and supporting many of our oil and gas customers in the south.
Get our wide array of technical resources delivered right to your inbox.
Unsubscribe at any time.