SOLIDWORKS Flow Simulation Pickup Truck Tailgate Drag Analysis
As SOLIDWORKS users, we know that simulation isn’t just for high-stakes engineering; it’s also a powerful tool for answering everyday questions. Remember the age-old debate about whether driving with your pickup’s tailgate up or down is better for fuel economy? It’s a well-known topic that’s sparked speculation and even caught the attention of MythBusters years ago. Now, we’re putting it to the test again, but this time, using SOLIDWORKS Flow Simulation to model the aerodynamics of a pickup truck in four different tailgate configurations.
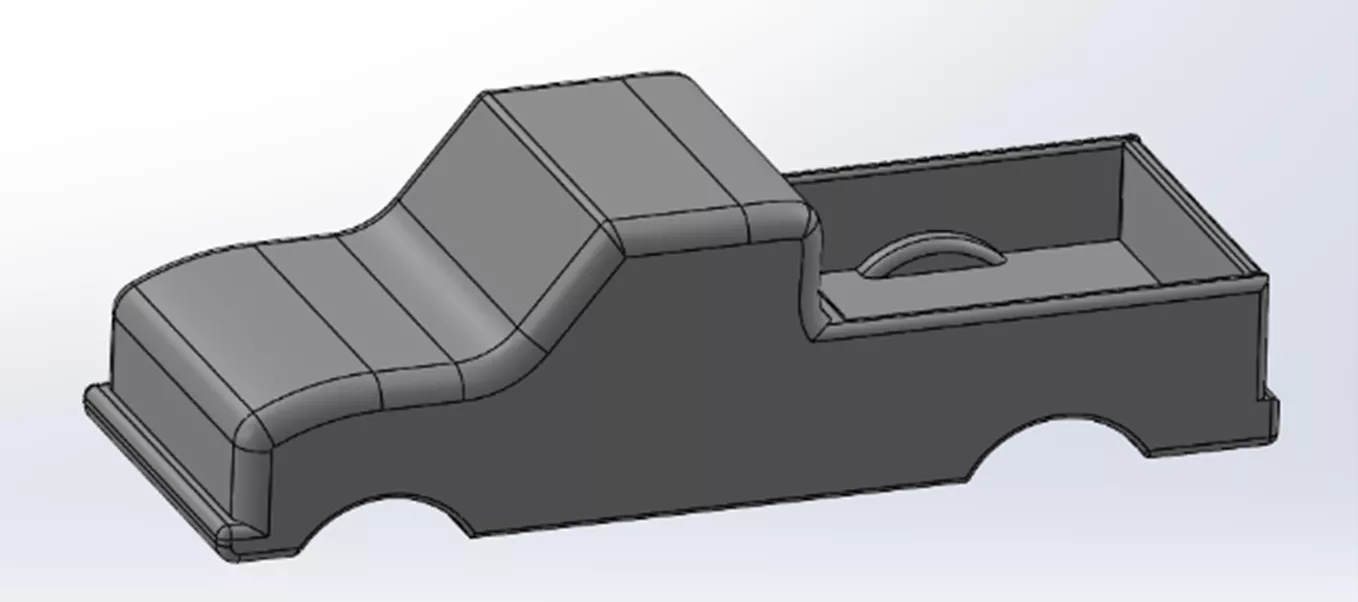
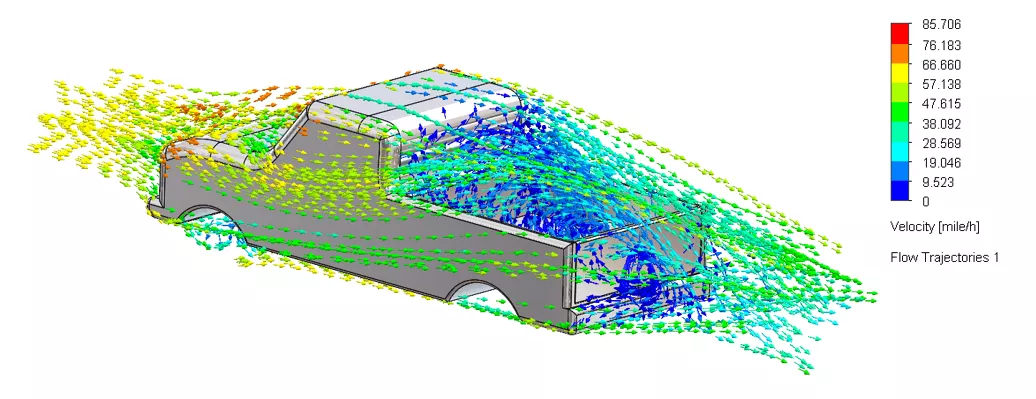
Tailgate up (standard position):
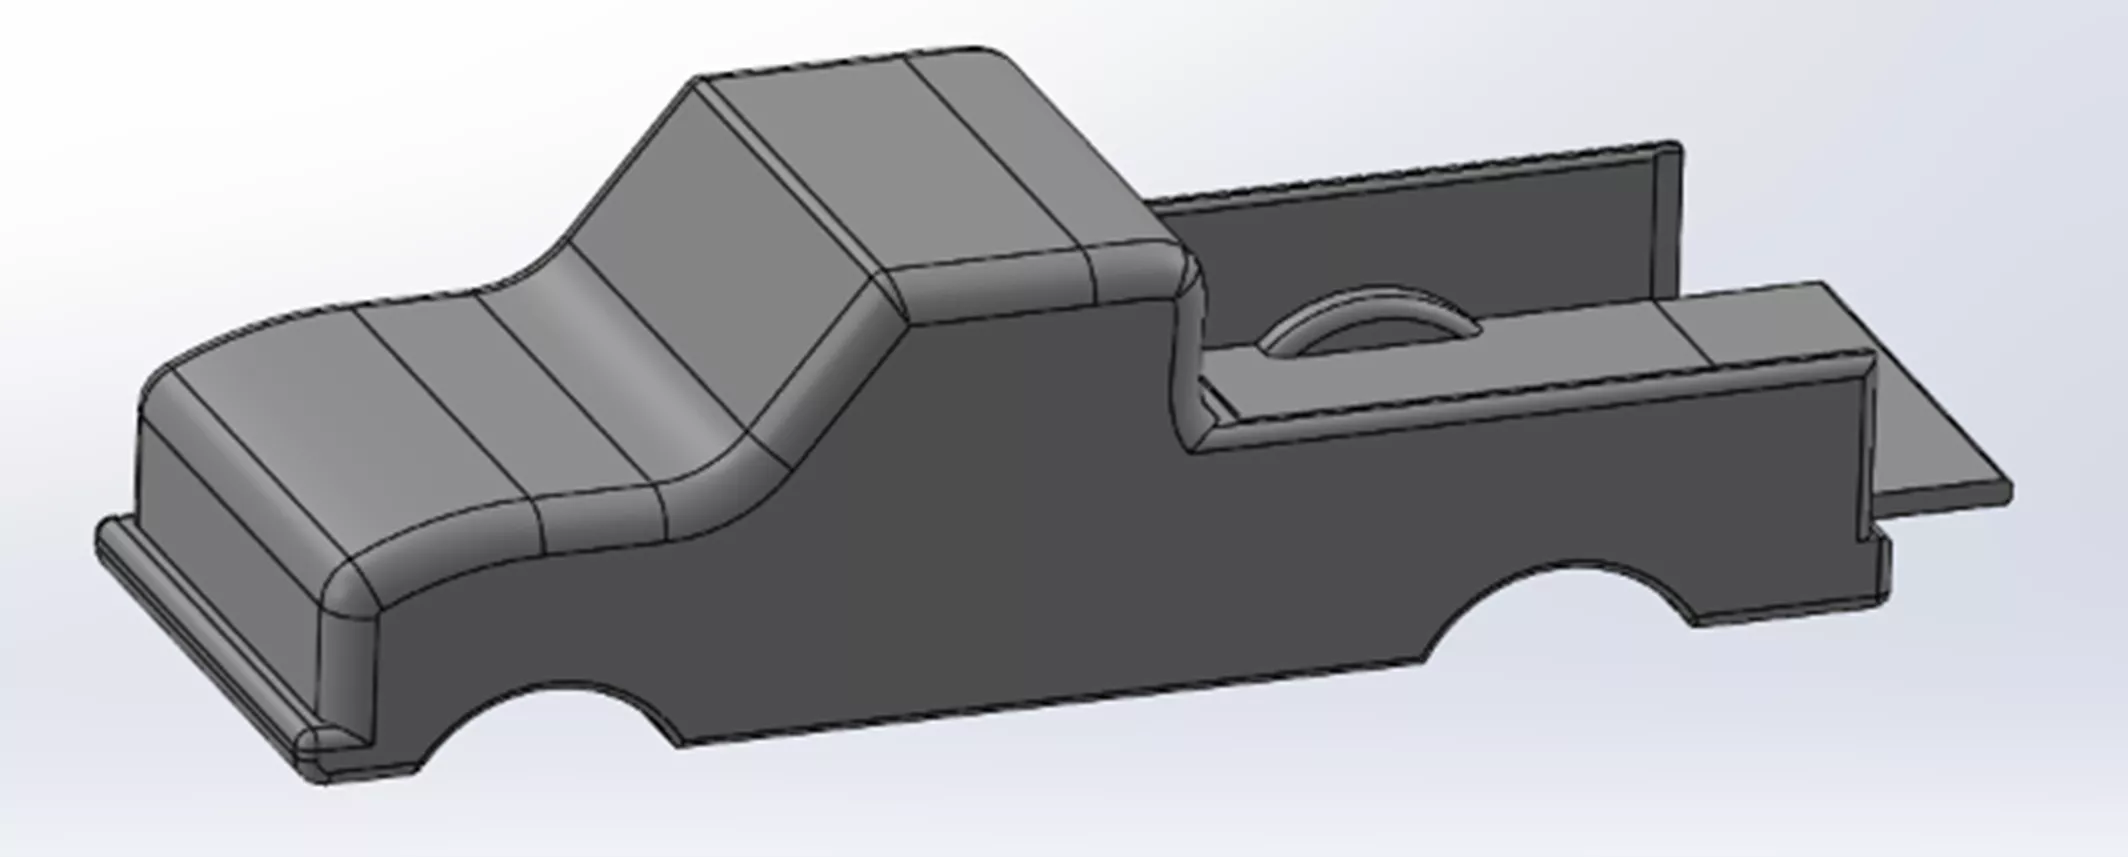
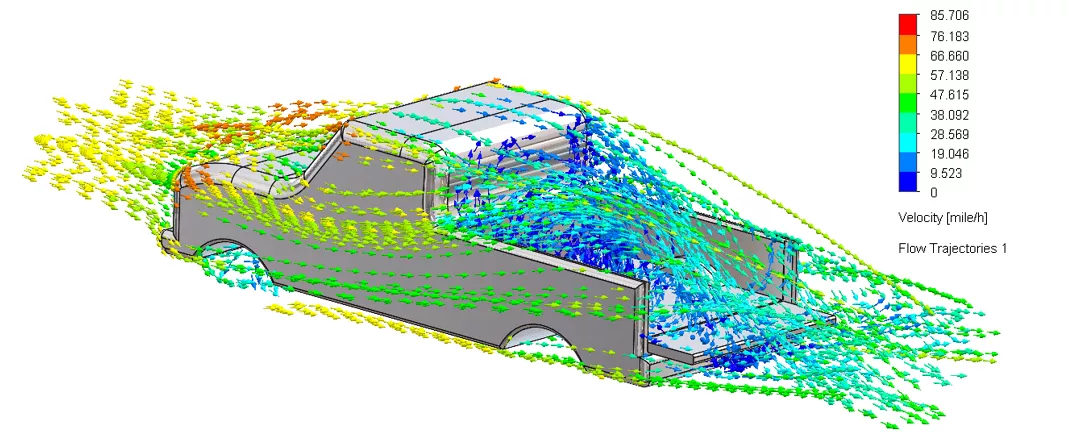
Tailgate down (flat, horizontal):
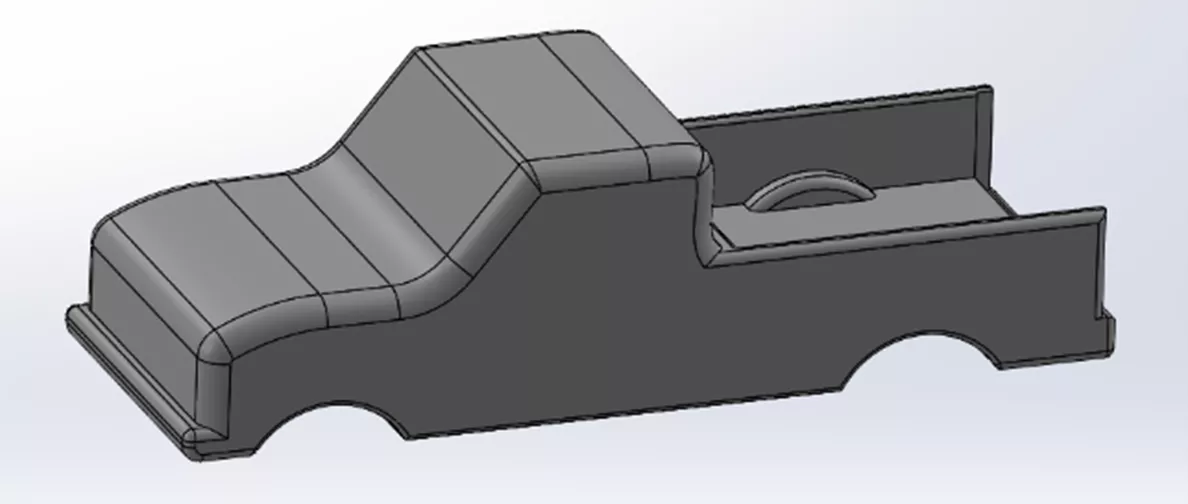
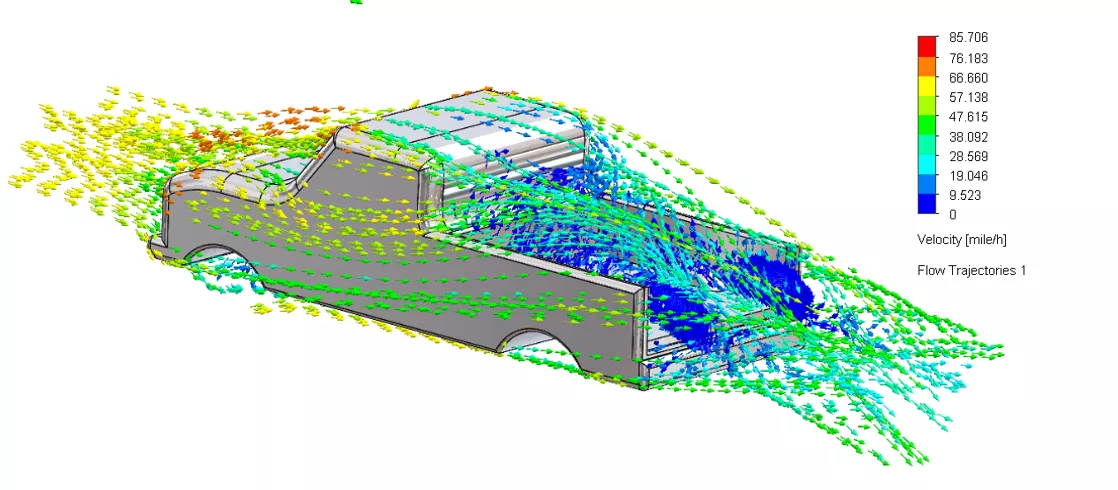
No tailgate (removed entirely):
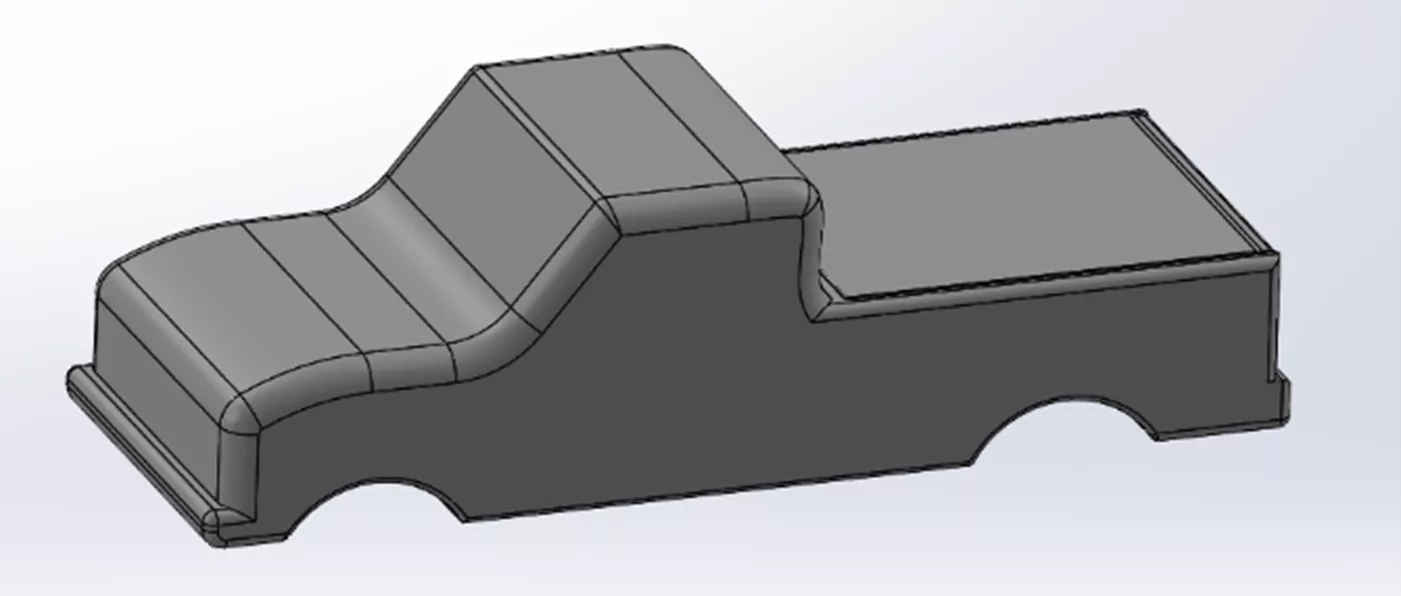
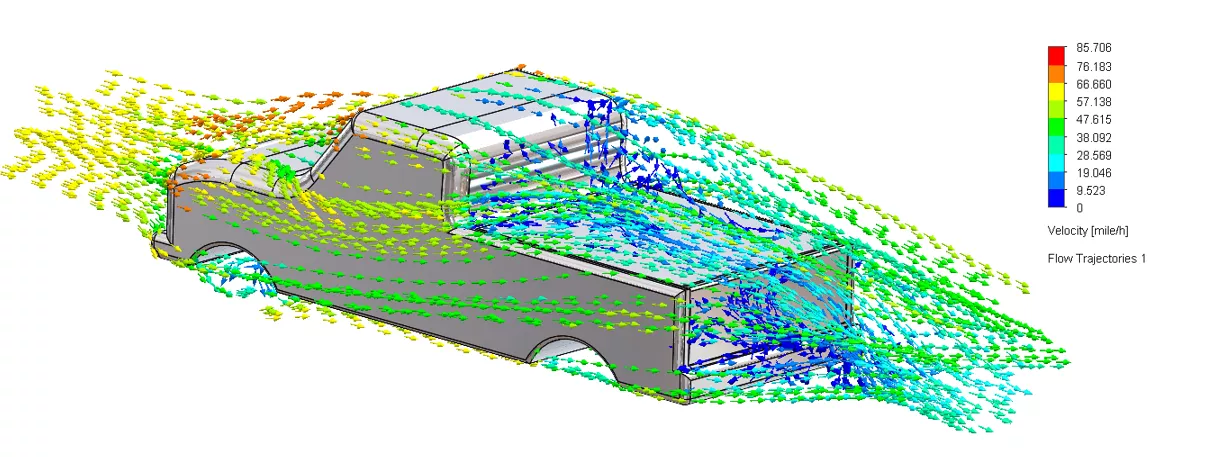
Truck bed covered (with a tonneau cover):
By analyzing the relative drag forces between each scenario, we’ll determine which setup offers the least resistance and how that translates into real-world fuel consumption differences.
The Tailgate Dilemma: What Does the Airflow Tell Us?
If you’ve ever driven a pickup at highway speeds, you’ve likely noticed the turbulence in the bed when the tailgate is up. Intuition suggests that lowering the tailgate reduces drag because air can flow out the back end of the truck bed unimpeded. But does the tailgate actually help manage airflow in a way that lowers overall drag?
This question has arisen over the years and has been empirically tested – most famously by the TV show MythBusters. Now, with SOLIDWORKS Flow Simulation, we can hopefully get to the bottom of the question once and for all. Here goes!
First, a simplified Toyota Tundra truck bed was modeled in SOLIDWORKS to scale, then:
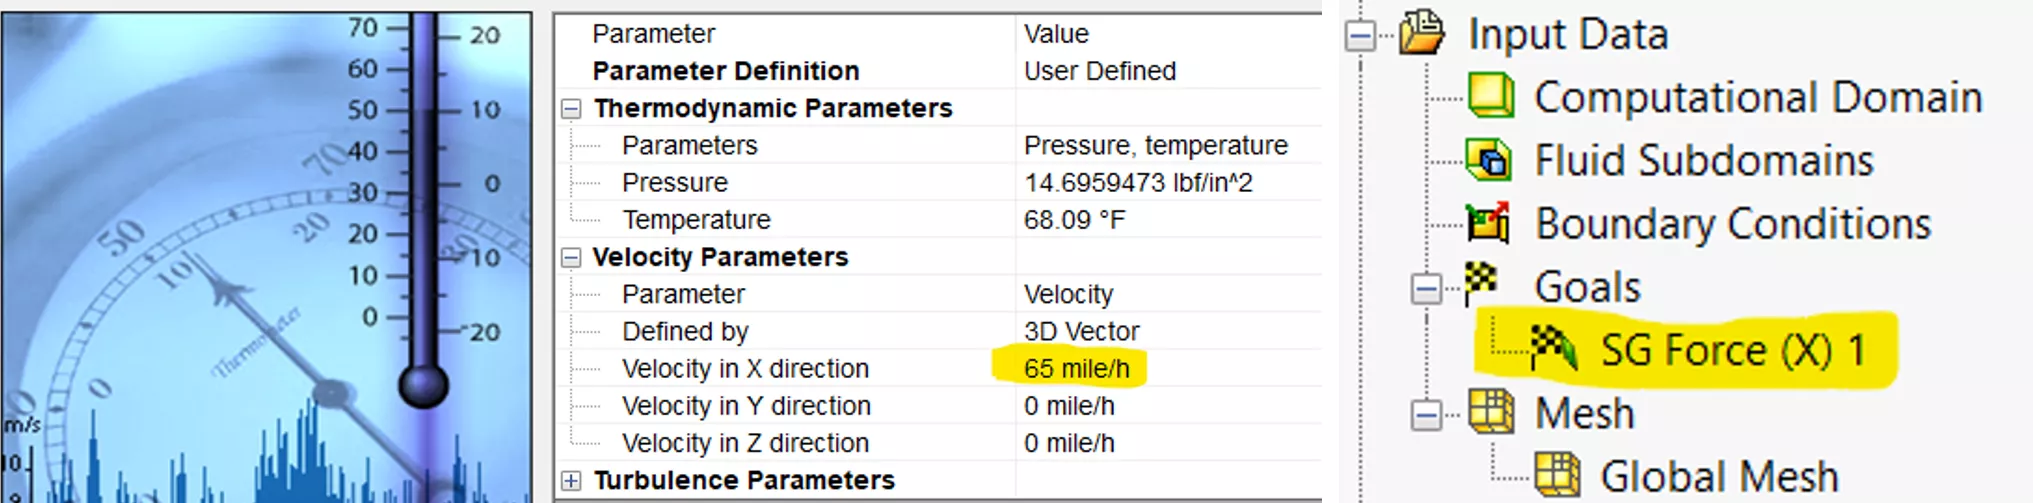
- SOLIDWORKS Flow Simulation was utilized to simulate air flow around the truck at a highway speed of 65 mph.
- Drag forces in the X-direction were determined across all four tailgate scenarios.
- The results were compared to see how the different configuration scenarios stacked up against each other.
- Fuel consumption estimates and comparisons were made based on the drag results.
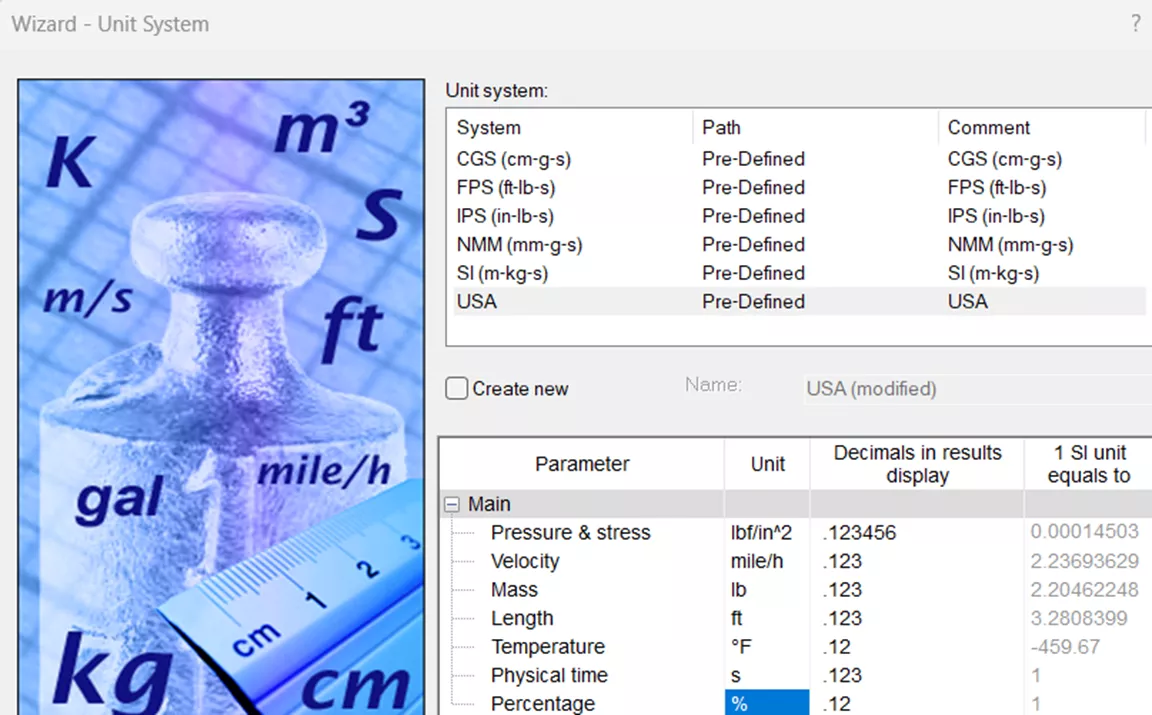
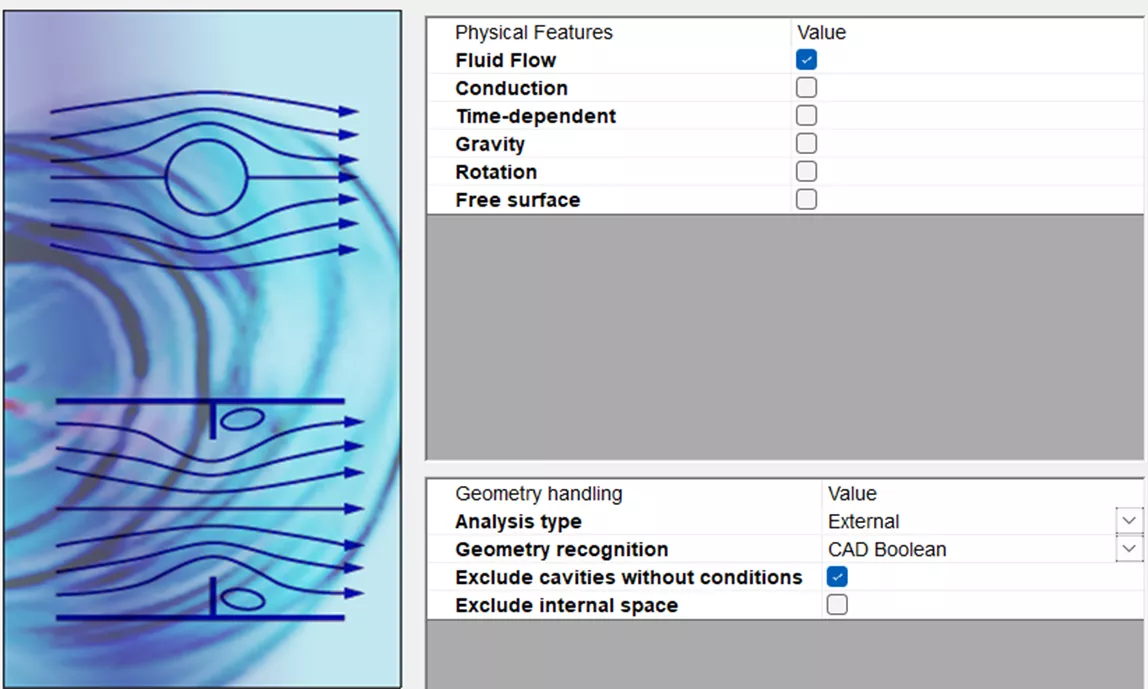
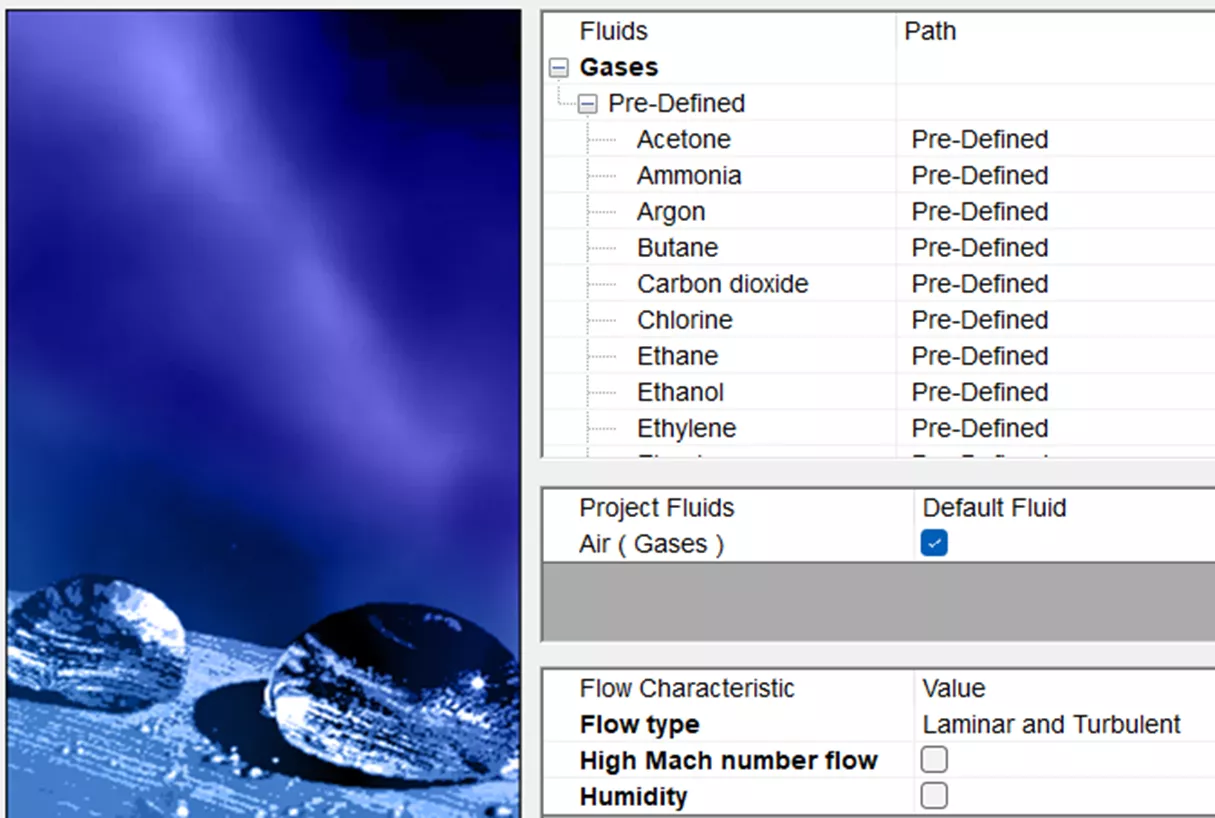
Setting Up the Analysis
Utilizing the Flow Simulation setup wizard, all initial conditions were defined.
Results
Surface goals were set to find all forces in the X-direction for each scenario with the relative “average” drag force (lbf) as the quantitative metric used in the comparison. SOLIDWORKS Flow Simulation trajectory plots were also compared, providing visual velocity gradients (mph) of the aerodynamic behavior influencing total drag. This was very useful in highlighting key flow features like vortices, stagnation zones, and streamlined regions.
Tailgate Up
| Goal Name | Unit | Value | Averaged Value |
| SG Force (X) 1 | [lbf] | 116.9 | 118.5 |
Tailgate Down
| Goal Name | Unit | Value | Averaged Value |
| SG Force (X) 1 | [lbf] | 136.2 | 119.4 |
No Tailgate
| Goal Name | Unit | Value | Averaged Value |
| SG Force (X) 1 | [lbf] | 121.5 | 120.7 |
Covered
| Goal Name | Unit | Value | Averaged Value |
| SG Force (X) 1 | [lbf] | 114.4 | 112.2 |
Result Comparison
Drag Force Comparison (lowest to Highest)
| Configuration | Averaged Drag Force (lbf) | Difference (lbf) | Percent Difference (%) |
| Covered | 112.2 | — | 0% (Baseline) |
| Tailgate Up | 118.5 | 6.3 | 5.60% |
| Tailgate Down | 119.4 | 7.2 | 6.40% |
| No Tailgate | 120.7 | 8.5 | 7.60% |
SOLIDWORKS Flow Simulation shows us that the Covered configuration (112.2 lbf) is the most aerodynamically efficient, with all other tailgate configurations increasing drag by 5.6–7.6%. The No Tailgate scenario counter-intuitively produced the highest drag at 120.7 lbf.
Aerodynamic Impact and Real-World Fuel Savings
While the No Tailgate configuration showed the highest drag increase (7.6% vs. Covered), the differences among the non-covered scenarios: Tailgate Up (5.6%), Tailgate Down (6.4%), and No Tailgate (7.6%), were relatively small (≤2% of each other). Given typical SOLIDWORKS Flow Simulation tolerances (±1–2% drag variation due to mesh sensitivity or solver convergence), these marginal differences suggest no statistically significant aerodynamic advantage between tailgate configurations in isolation.
Fuel Consumption Comparison
| Configuration | Drag Increase vs. Covered | Estimated MPG (Highway) | Fuel Cost Per 1,000 Miles (USD) |
| Covered | — (Baseline) | 25.0 mpg | $120.00 |
| Tailgate Up | 5.60% | 24.3 mpg (-0.7 mpg) | $123.50 |
| Tailgate Down | 6.40% | 24.2 mpg (-0.8 mpg) | $124.00 |
| No Tailgate | 7.60% | 24.0 mpg (-1.0 mpg) | $125.00 |
The fuel economy estimates correlate directly with the SOLIDWORKS drag data, applying the industry-observed rule that a 1% drag increase reduces highway fuel efficiency by ~0.5%. Compared to the Covered baseline (25 mpg at 112.2 lbf), the No Tailgate scenario’s 7.6% higher drag projects a 1.0 mpg loss, while Tailgate Up/Down shows smaller values (≤0.8 mpg). These differences, translating to <$5 per 1,000 miles between configurations, suggest that while bed coverage is critical, tailgate position alone has a negligible real-world impact.
I hope you found this deep dive into pickup truck aerodynamics as fascinating as I did! What started as a simple question – ‘Does tailgate position actually matter?’ – turned into a perfect demonstration of how SOLIDWORKS Flow Simulation can turn everyday curiosities into data-driven insights. Whether you’re an engineer optimizing designs, a fleet manager chasing fuel savings, or just someone who loves a good myth-busting experiment, a tool like SOLIDWORKS Flow Simulation puts the power of virtual testing at your fingertips.
Please take a look at some other GoEngineer articles related to SOLIDWORKS Flow Simulation below. Additionally, join the GoEngineer Community to participate in discussions, create forum posts, and answer questions from other SOLIDWORKS users.
SOLIDWORKS CAD Cheat Sheet
SHORTCUTS ⋅ MOUSE GESTURES ⋅ HOT KEYS
Our SOLIDWORKS CAD Cheat Sheet, featuring over 90 tips and tricks, will help speed up your process.
More SOLIDWORKS Flow Simulation Articles
SOLIDWORKS Flow Simulation Semi-Truck Drafting and Drag Impacts
Testing Aquarium Filters Using SOLIDWORKS Flow Simulation
Outsmarting Drag Using SOLIDWORKS Flow Simulation
What is SOLIDWORKS Flow Simulation Used for? Top 5 Use Cases
![]()
About James Carlin
James Carlin is a SOLIDWORKS Technical Support Engineer at GoEngineer.
Get our wide array of technical resources delivered right to your inbox.
Unsubscribe at any time.