SOLIDWORKS Flow Simulation Results Analysis Tools Explained
SOLIDWORKS Flow Simulation features several easy-to-use results analysis tools that make understanding and analyzing results more convenient.
SOLIDWORKS Flow Simulation Results Analysis Tools
These tools inlclude:
- Probe
- Display Mode
- Min/Max Table
- Results Summary
- Refinement Table
- Batch Results Processing
- View Settings
- Context Animation
- Play Settings
- Screen Capture
- Save Image Without Visualization
- Compare Tool
You can find these tools in a few different locations. The two options below are the most common, other than finding them in the Flow Simulation tab in the CommandManager.
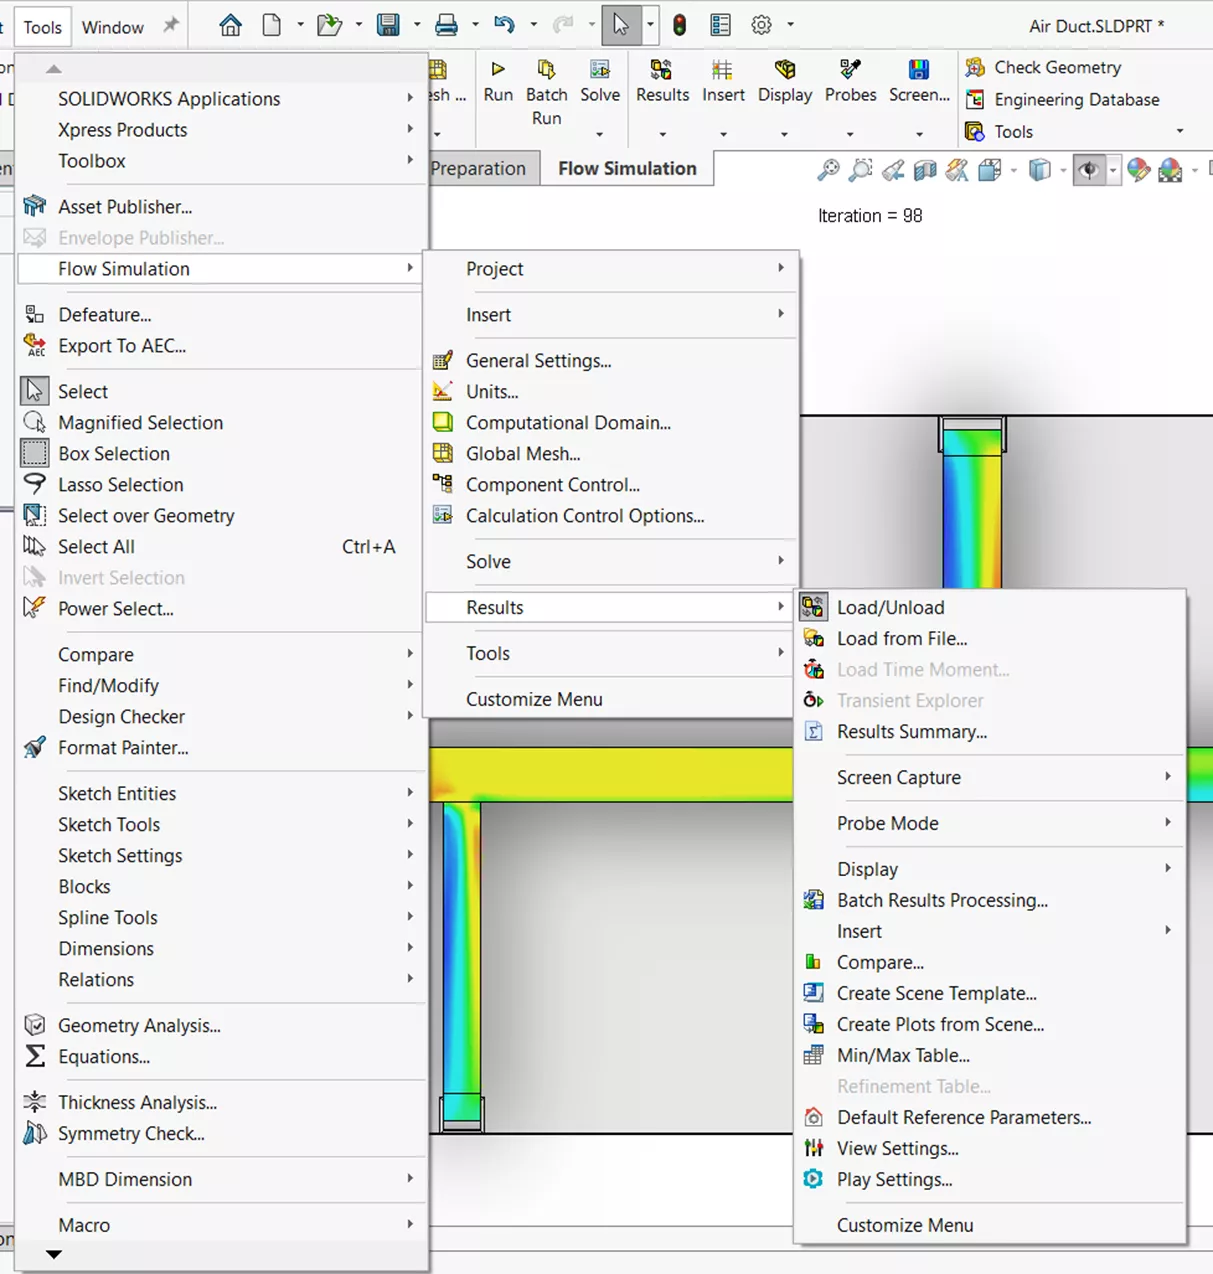
Option 1: Tools > Flow Simulation > Results
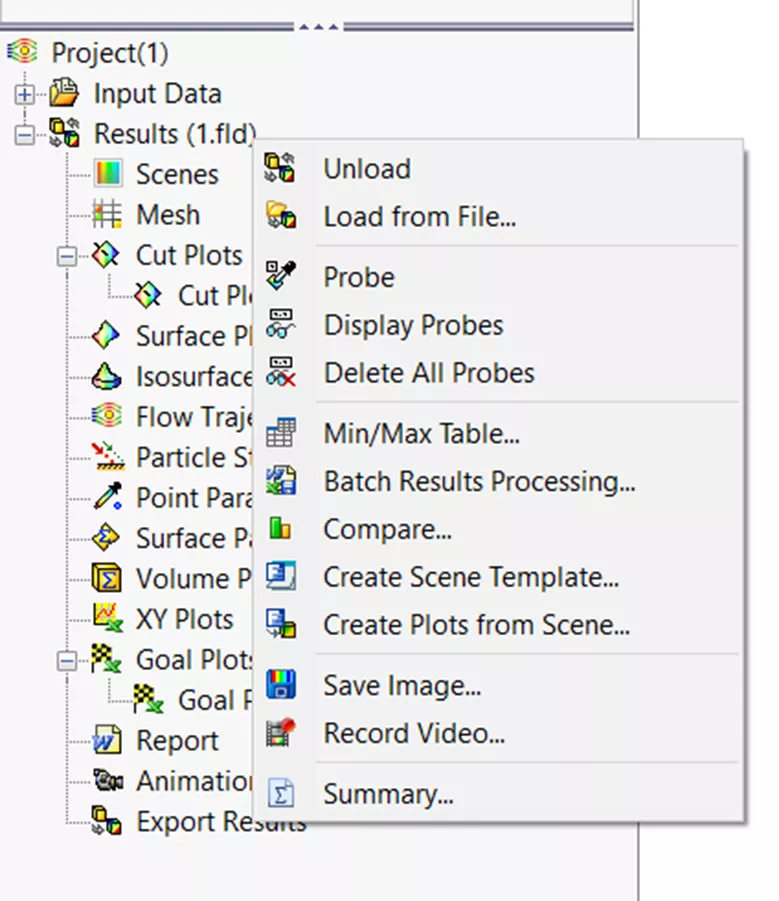
Option 2: RMB on Results from the Flow Simulation tree after the study has been ran.
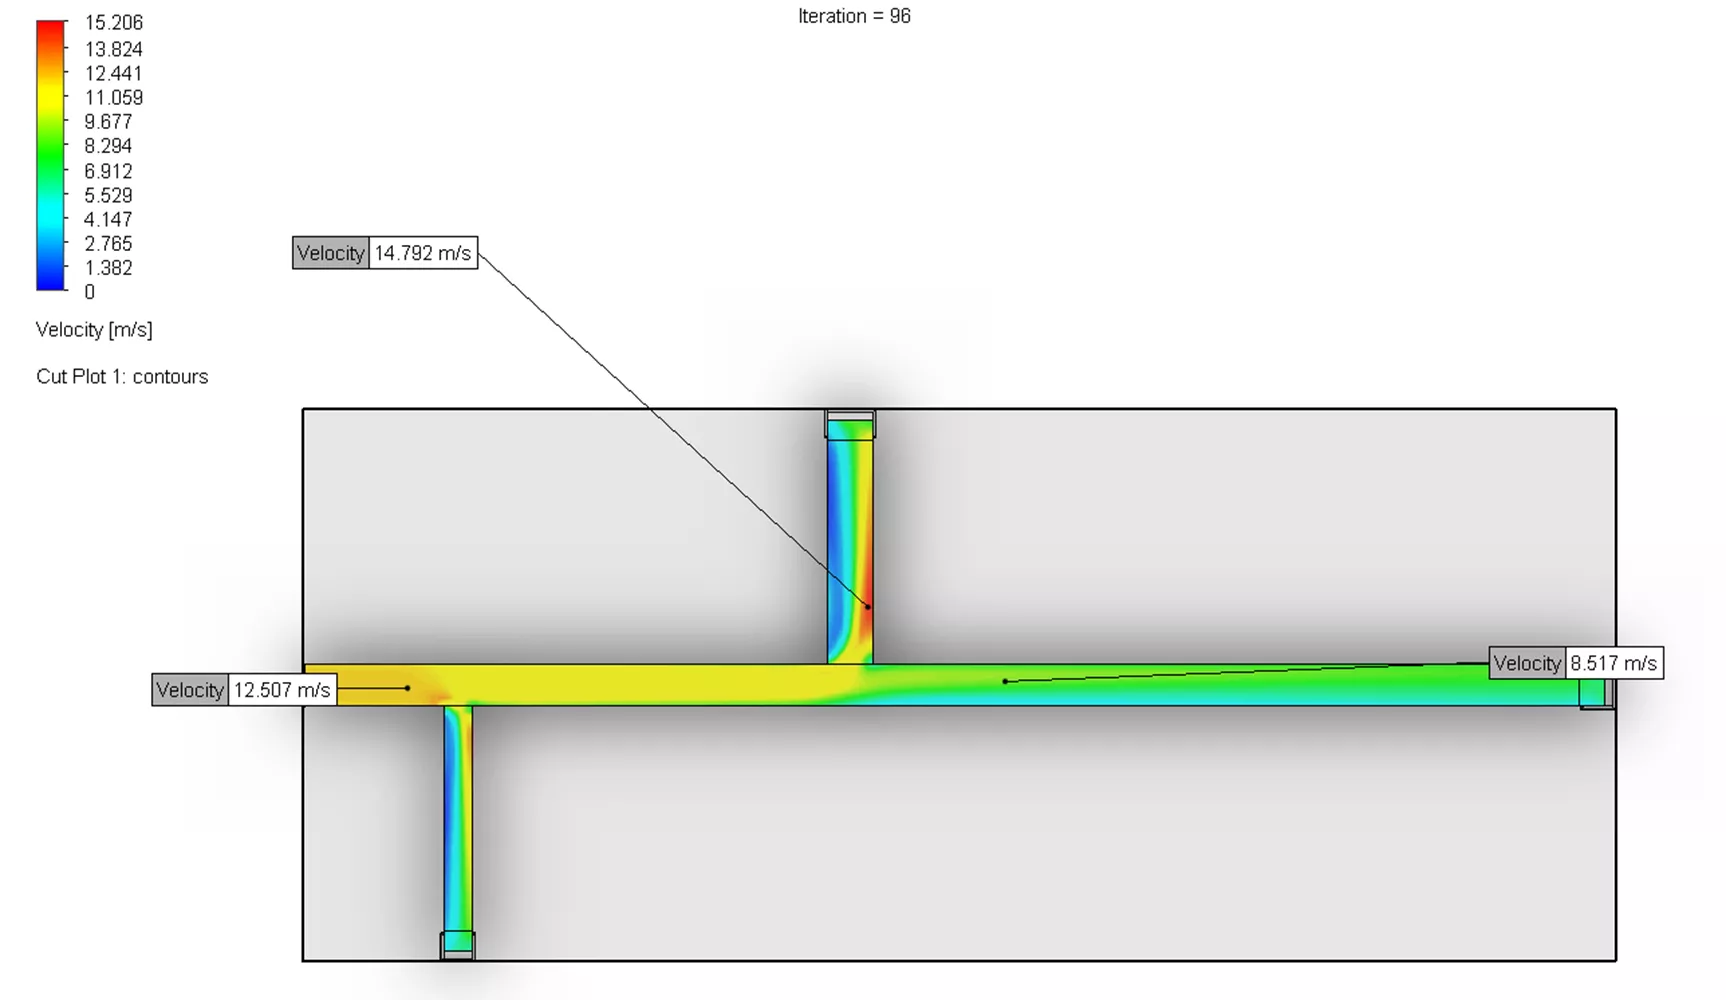
Probe
The Probe tool displays values of parameters when hovering over any location in Cut Plots or Surface Plots. (It exists in both locations mentioned above.) A plot must be showing to have the probed values appear. If you want to keep a probe result showing, click on the location, and it will save that value in the graphics area.
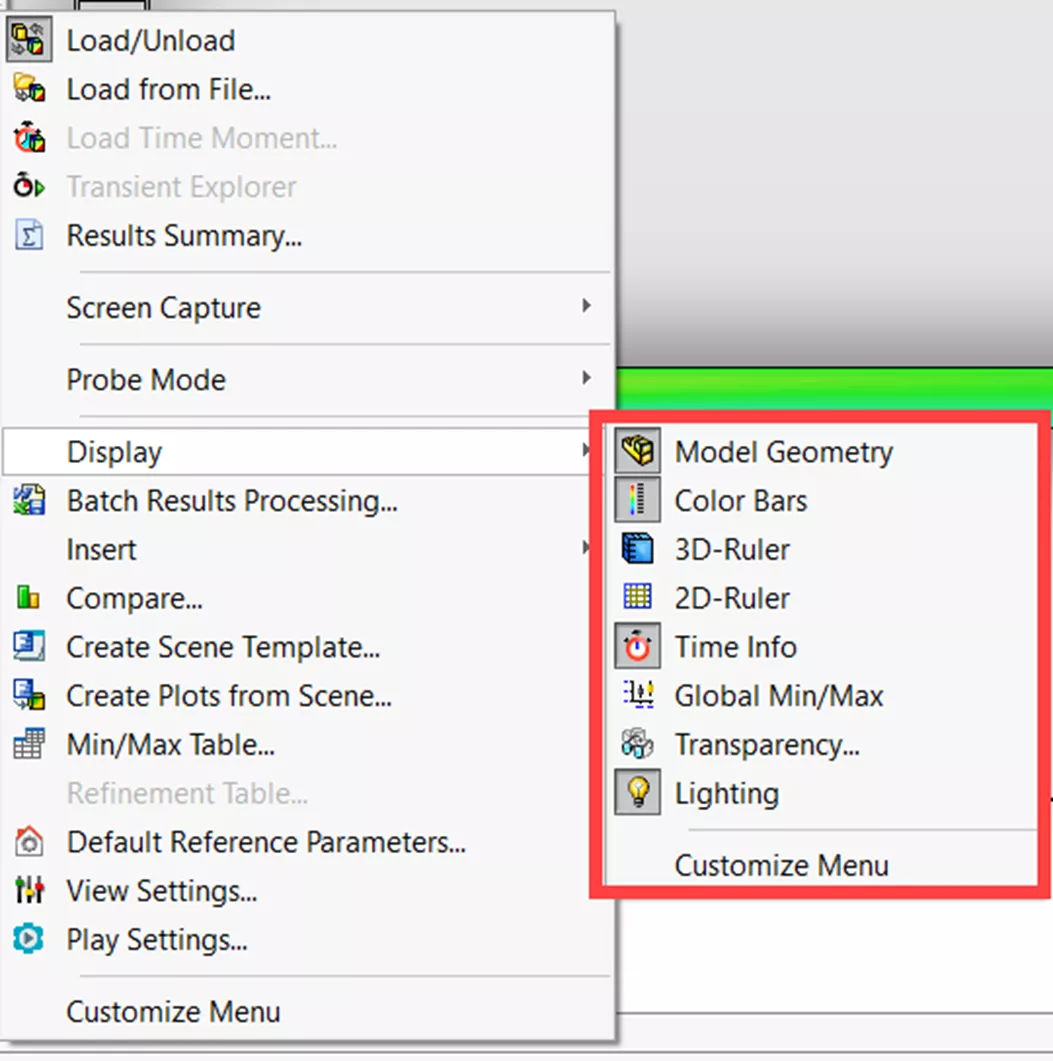
Display Mode
With this tool, pick which display modes you want to see in the active view when analyzing the results. These options include Model Geometry, Color Bars, 3D-Ruler, 2D-Ruler, Time Info, Global Min/Mas, Transparency, and Lighting. (This is only in the first location mentioned above.)
Min/Max Table
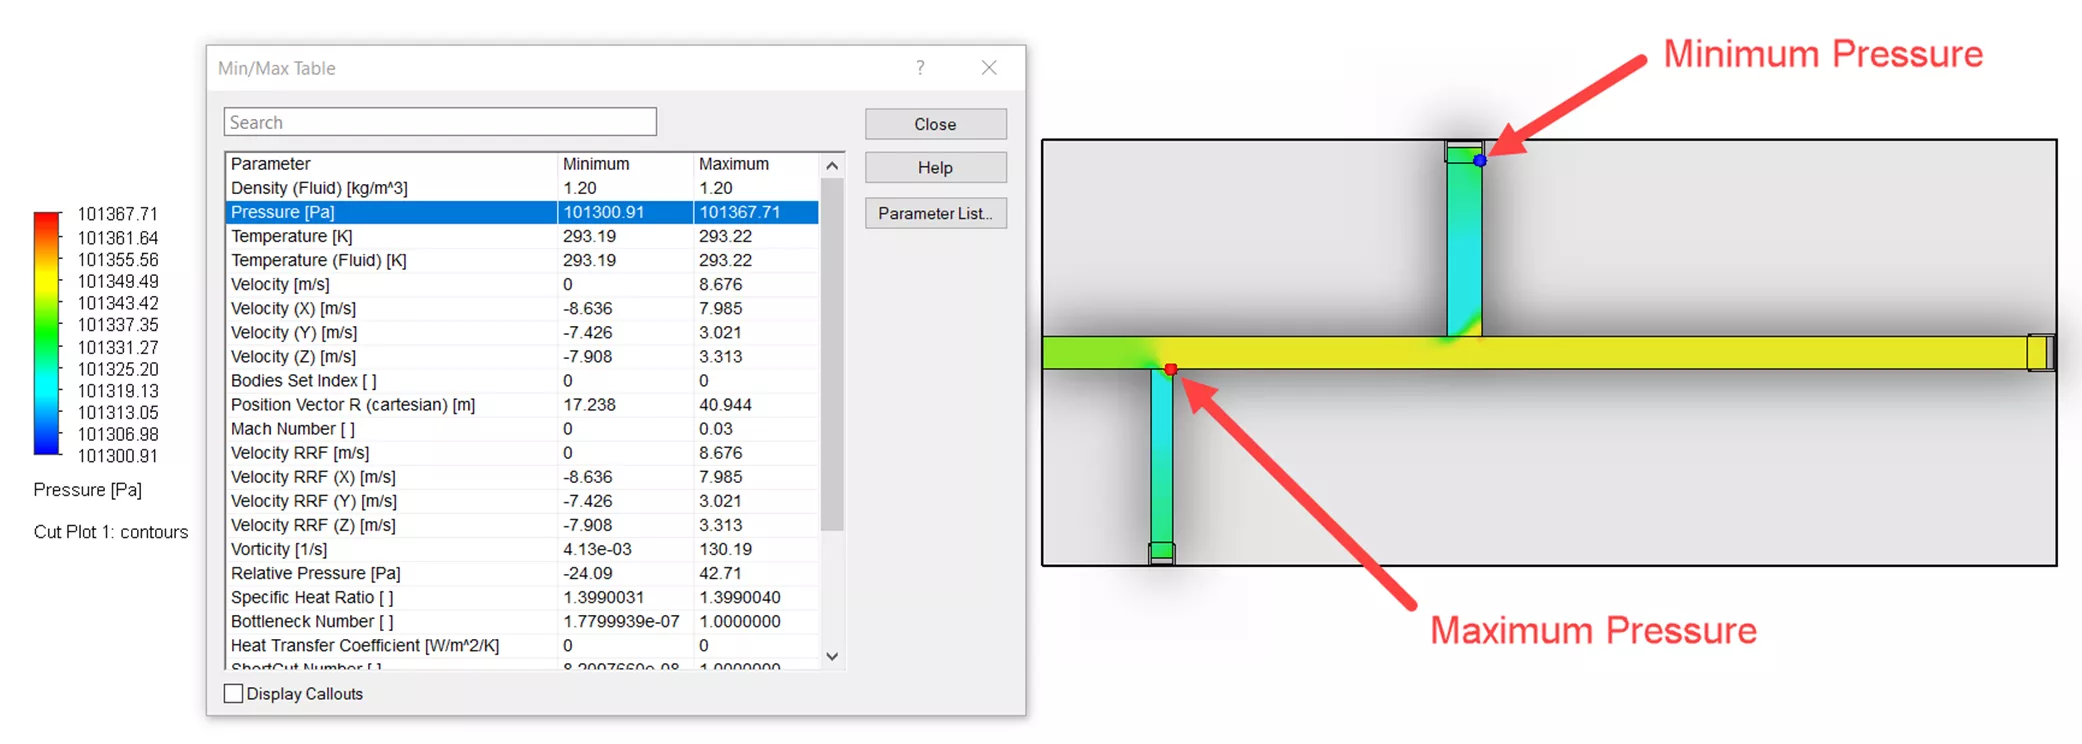
The Min/Max Table shows all the minimum and maximum values for various variables such as Density, Pressure, Temperature, Velocity, etc. These values are calculated over the entire computational domain, and this tool is in both the locations mentioned above.
Once you open the Min/Max Table, selecting a variable causes red and blue dots to appear on the model in the location of where the minimum or maximum values occur. Blue dots represent the location of the minimum value, and red dots represent the location of the maximum value.
Results Summary
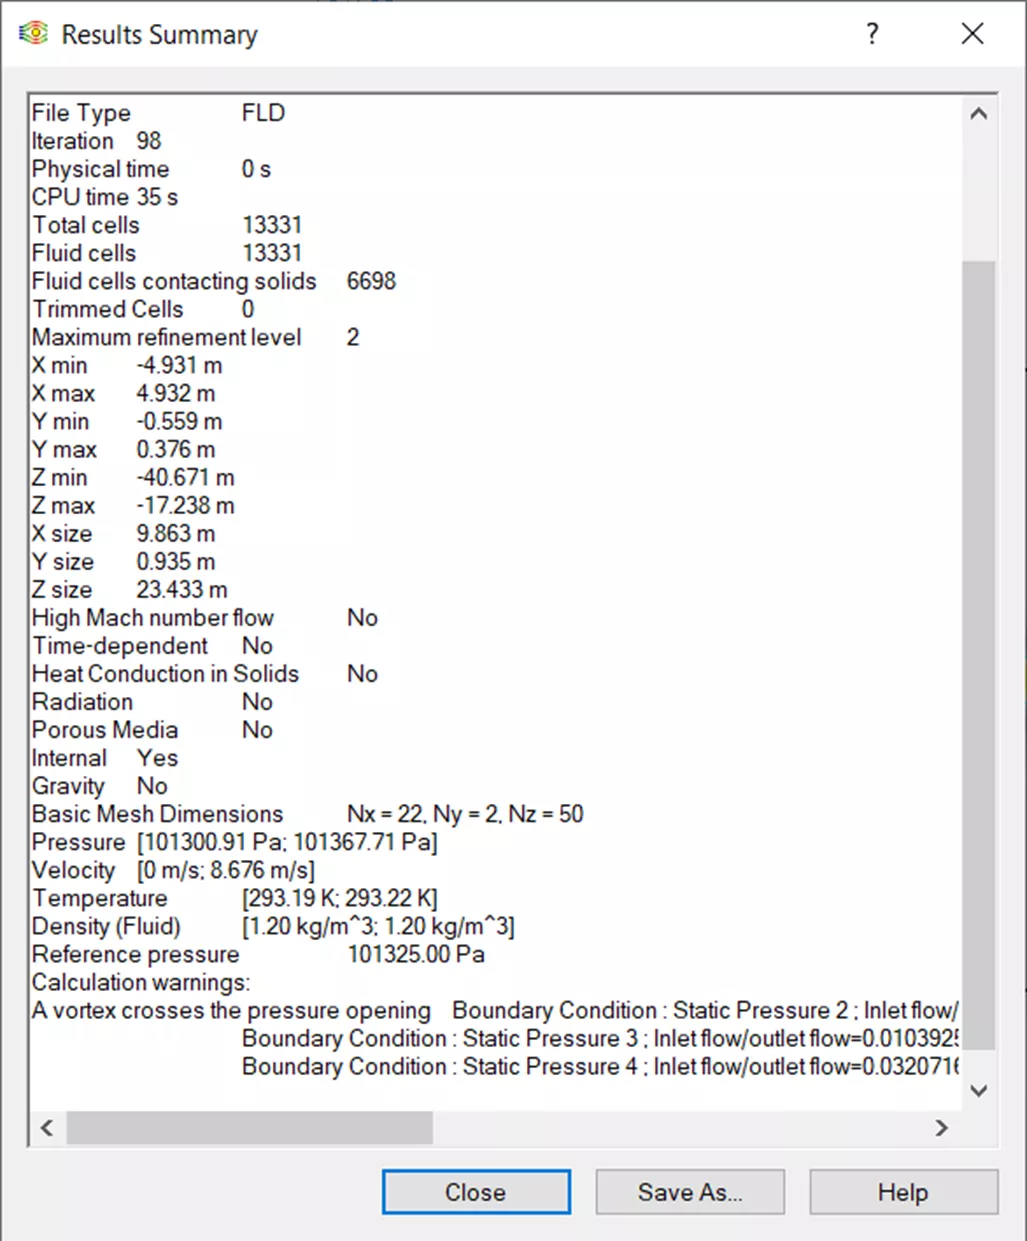
The Results Summary provides a brief summary of the information involved in the study. It includes an overview of the computational domain and mesh dimensions. It also contains the physical features, the physical and CPU time to solve, number of iterations, min/max values for pressure, velocity, temperature and density, as well as a few other variables related to the study. The Results Summary can only be found in the first location mentioned above.
Refinement Table
The Refinement Table can be used when there are solution-adaptive refinements made in the project. The table displays information about those refinements that occur during the calculation. This can be found in the first location mentioned above.
Batch Results Processing
Batch Results Processing creates standard reports, goal plots, and XY plots automatically for projects. You can find Batch Results Processing in either of the aforementioned locations.
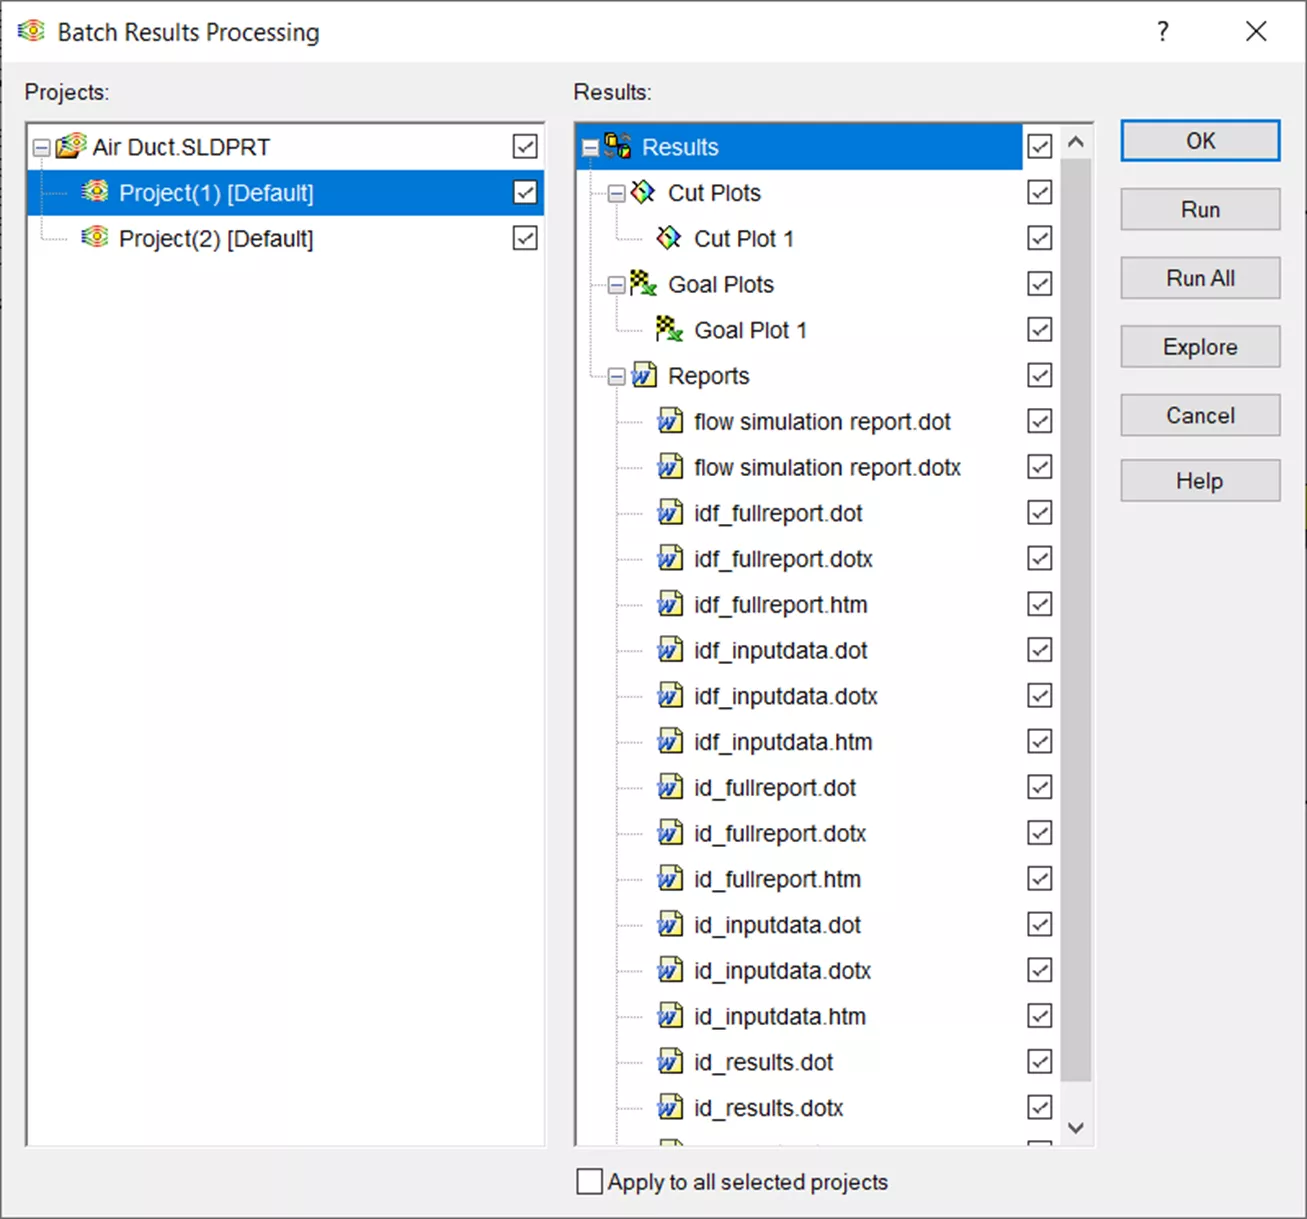
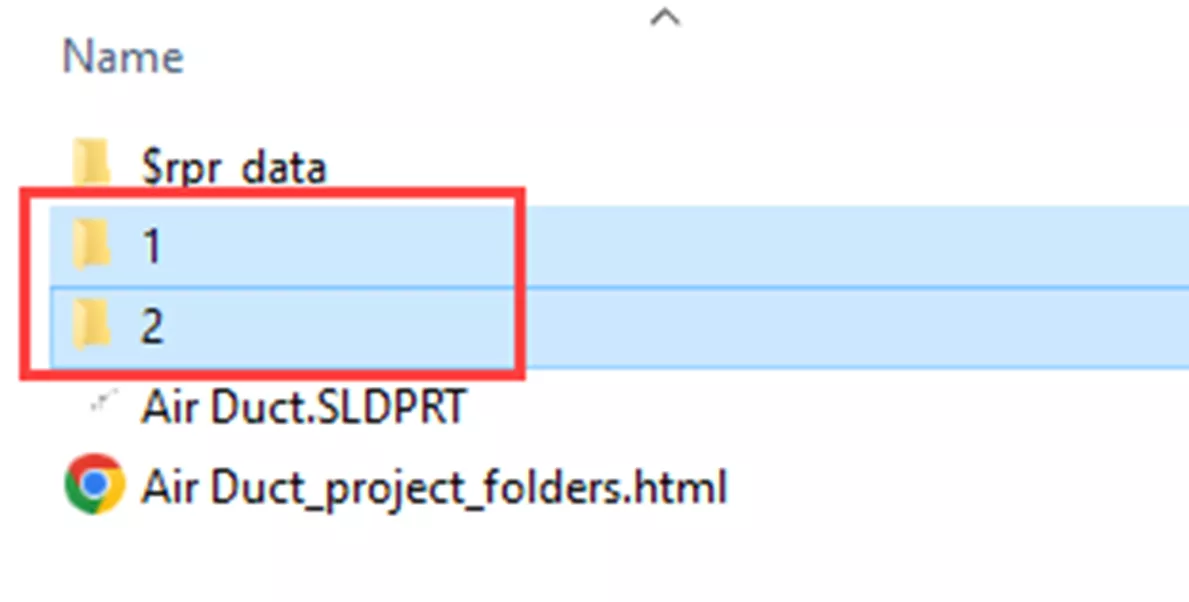
Once the dialog box appears, select any plot or report for any of the projects to create a report from. Then, select Run, and SOLIDWORKS Simulation will generate the reports and save them in the same location as the file in their respective project folder (i.e., 1 or 2 as seen below).
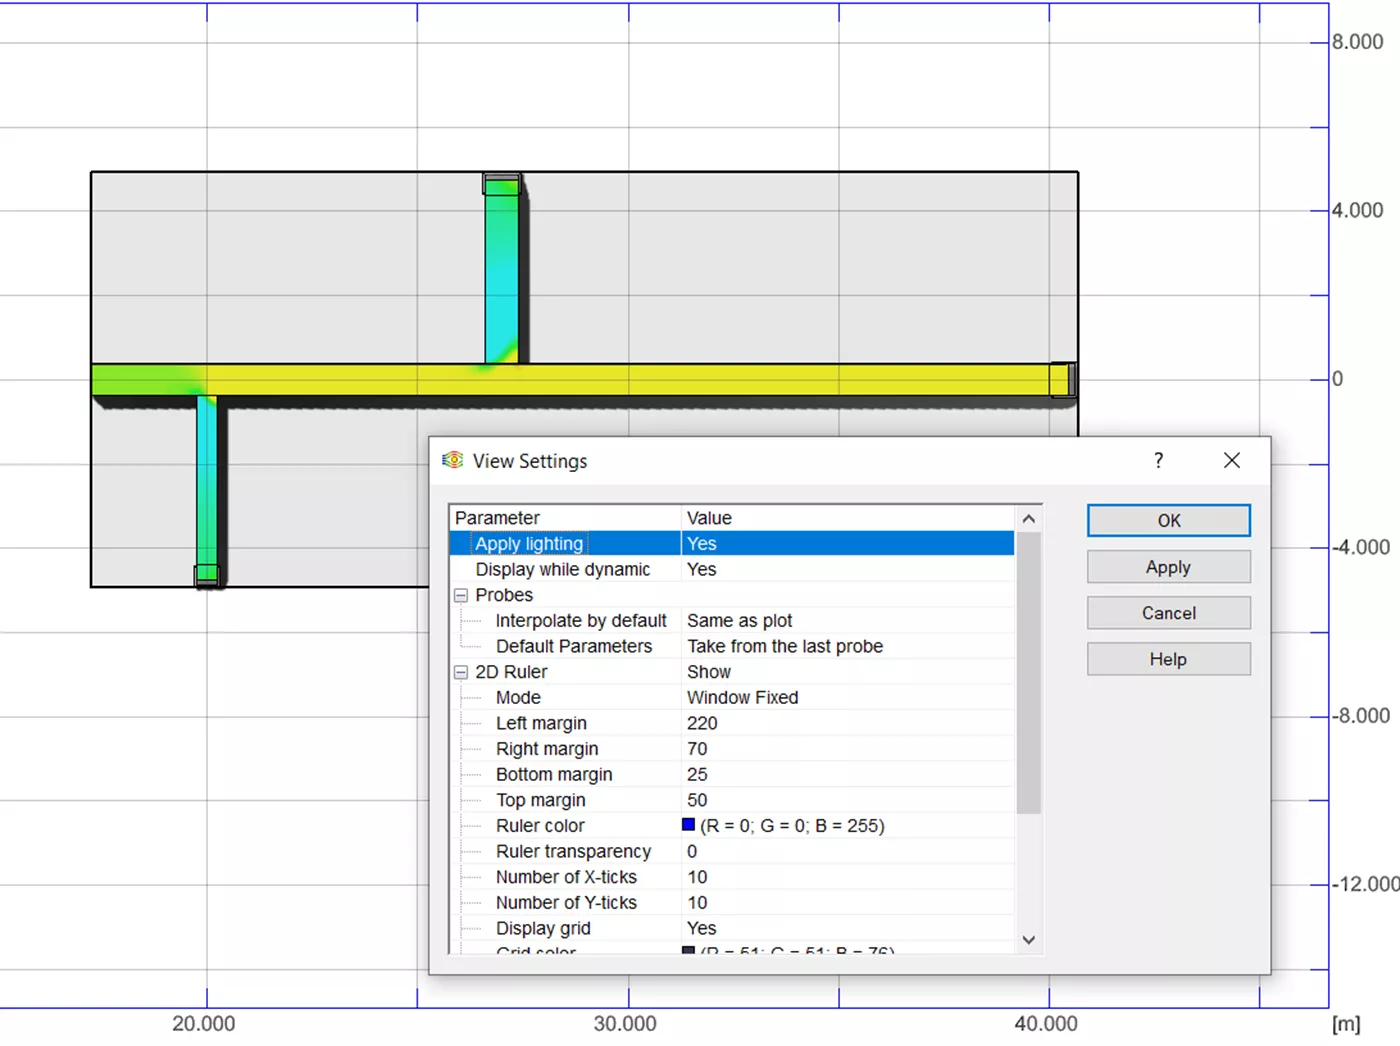
View Settings
View Settings gives you the option to specify how the 2-D or 3-D Rulers are displayed, if at all. You can also change the lighting and probe settings here for better displays. This can only be found in the Tools options menu.
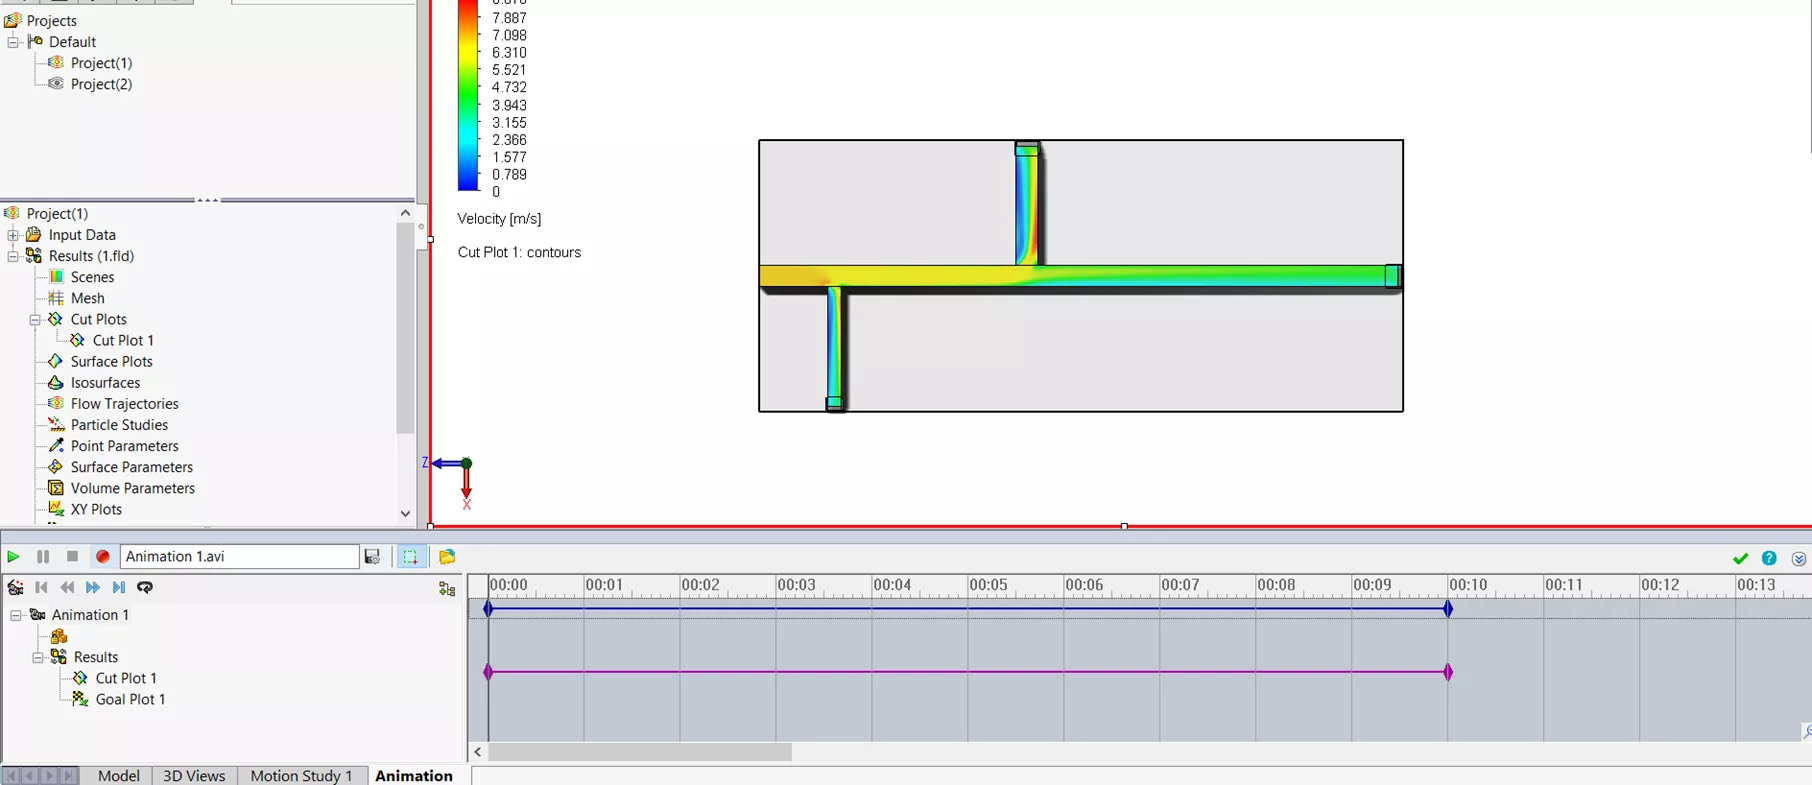
Context Animation
Create a quick animation of the results from a Cut Plot, Flow Trajectories, or Particle Studies using Context Animation. This tool is not found in either of the locations mentioned above. Instead, to create an animation, right-click on any Cut Plot, Flow Trajectory, or Particle Study then select Animation. The animation dialog will appear at the bottom of your SOLIDWORKS screen and you can play, pause, stop, and save this animation.
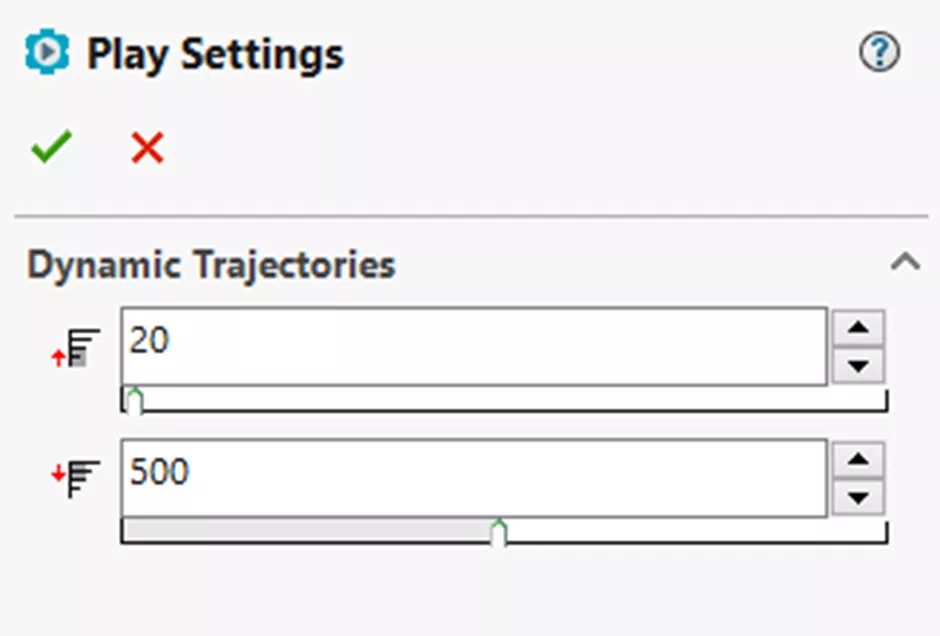
Play Settings
The Play Settings option is only for dynamic flow trajectories. These settings allow you to choose the min and max context animation speed. You will only find these settings under the Tools menu.
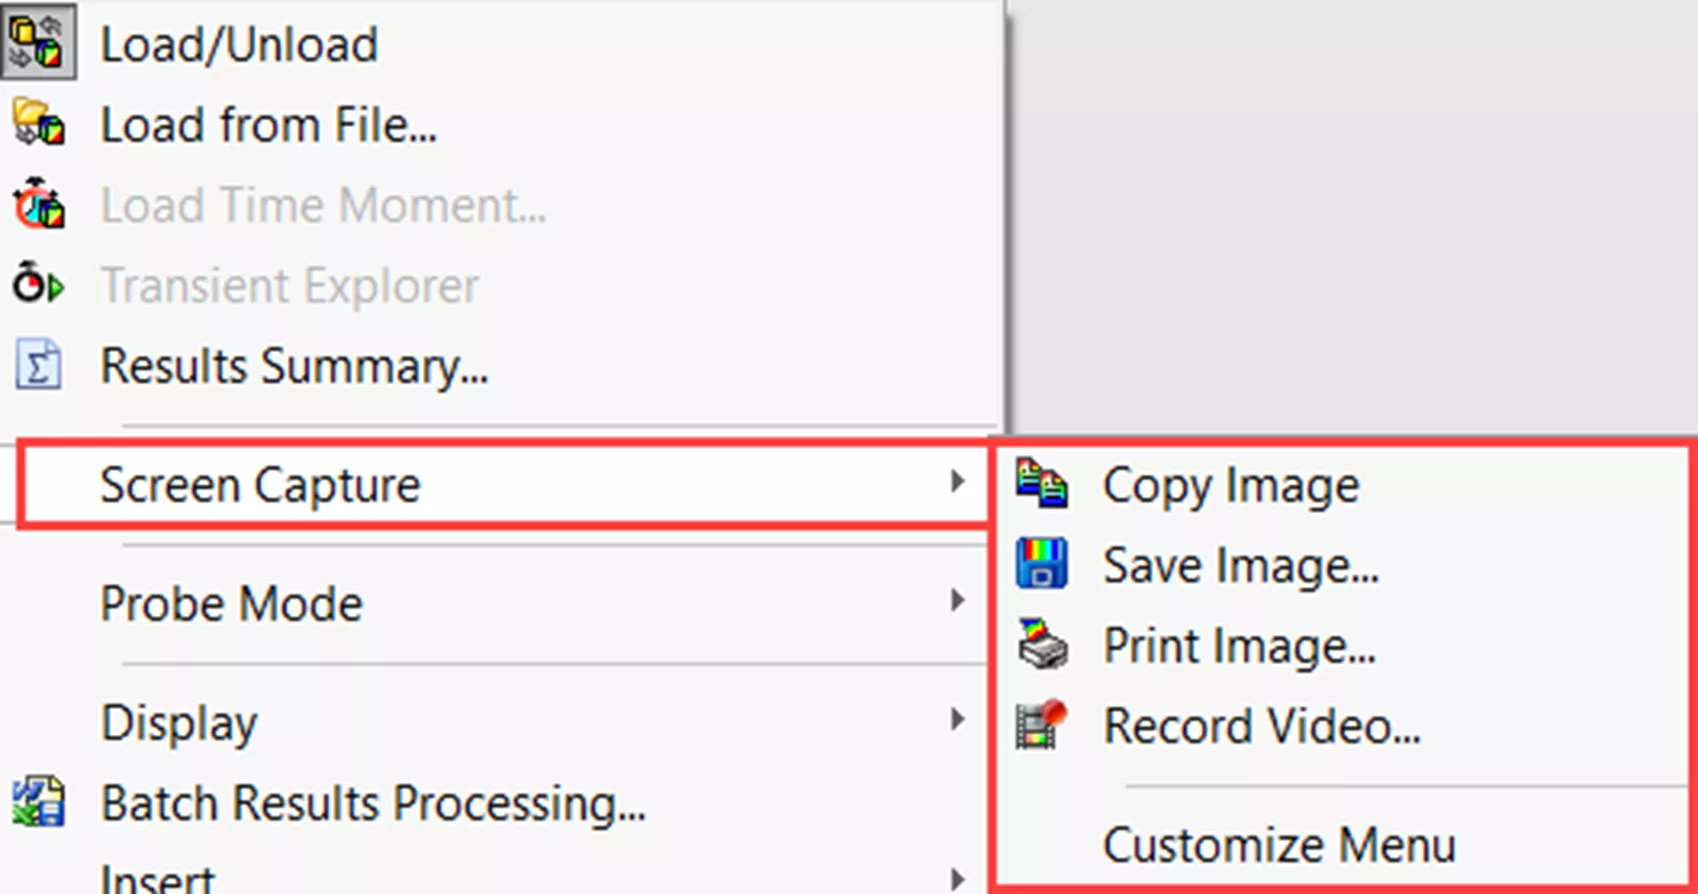
Screen Capture
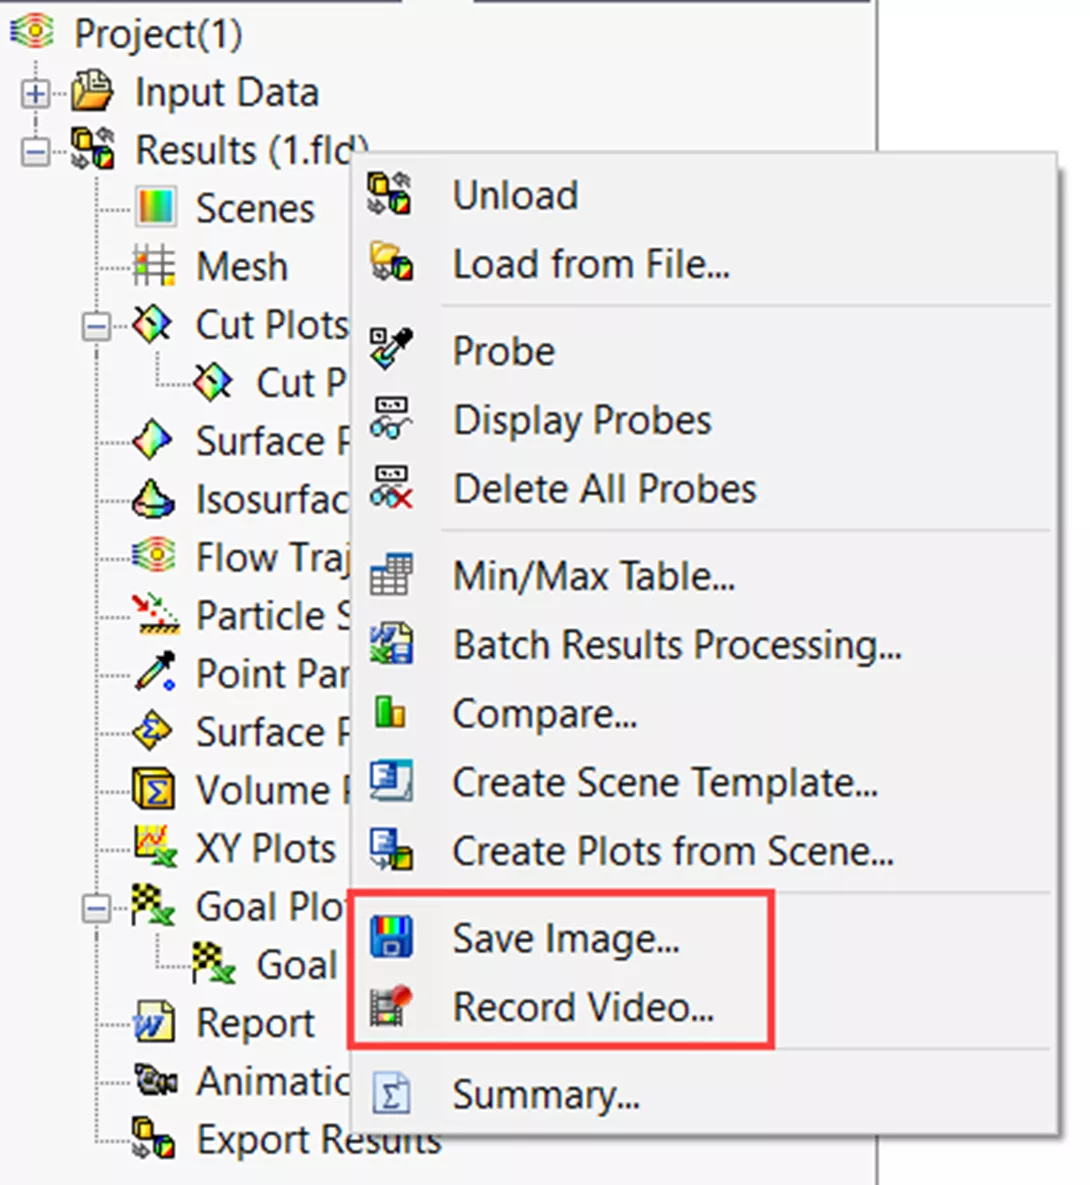
Screen Capture has a few different options, including Copy Image, Save Image, Print Image, and Record Video. This is found in the first location, however, Save Image and Record Video can also be selected through the right-click menu as well.
- Copy Image copies a screenshot of the active view to the clipboard.
- Save Image saves the view as a bitmap file.
- Print Image will print the view.
- Record Video records any interactions in the design space and saves them as an .avi file.
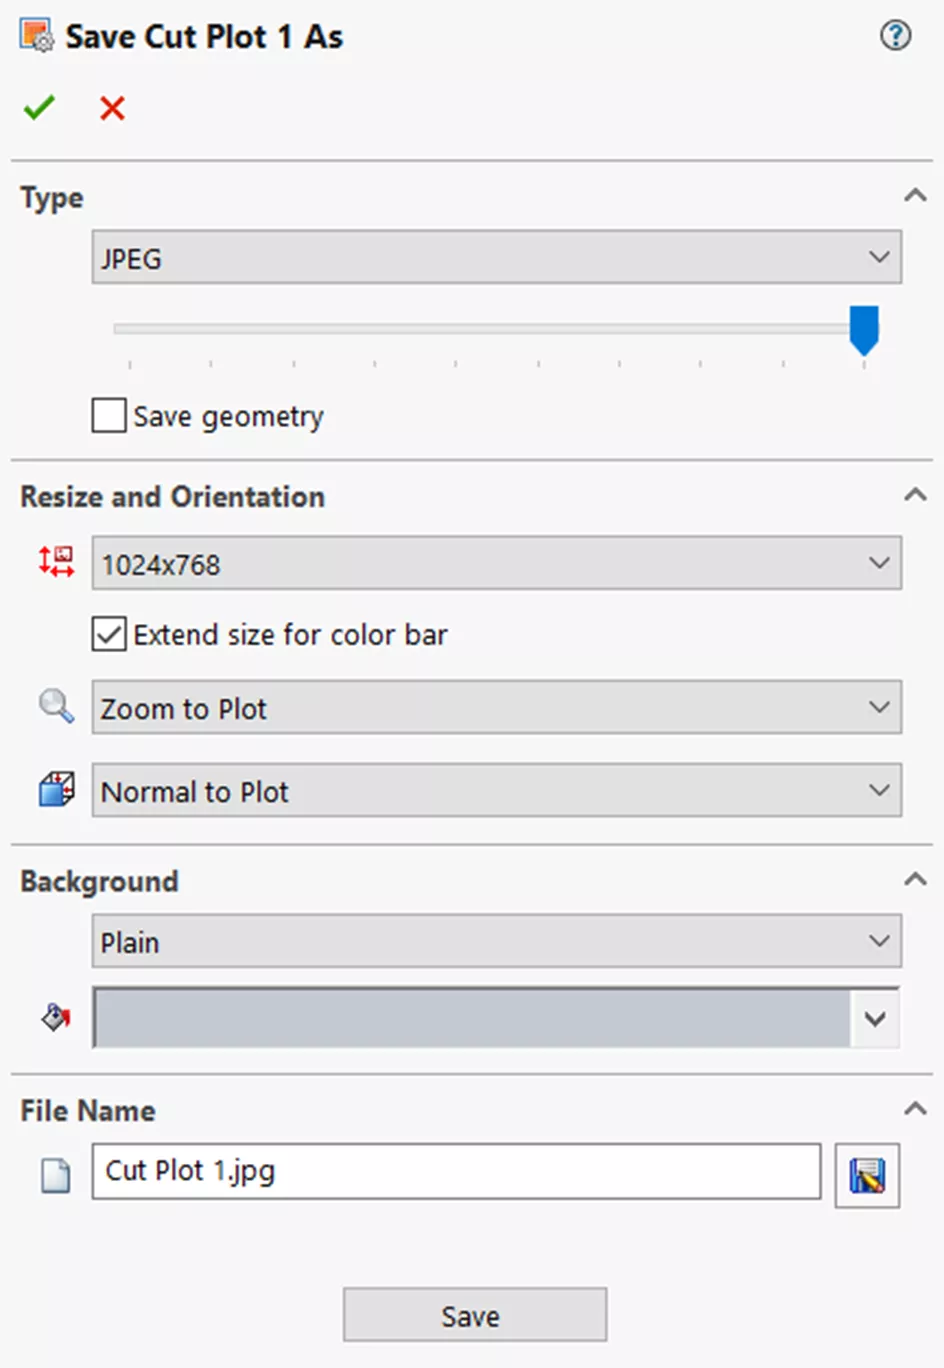
Save Image Without Visualization
This option allows you to save images of plots, trajectories, and isosurfaces in various formats and sizes without the results being shown in the graphics area. To do so, right-click on the plot, trajectory, or isosurface and select Save As. These can be saved as JPEG, BMP, PNG, VRML, GIF, and eDrawing files.
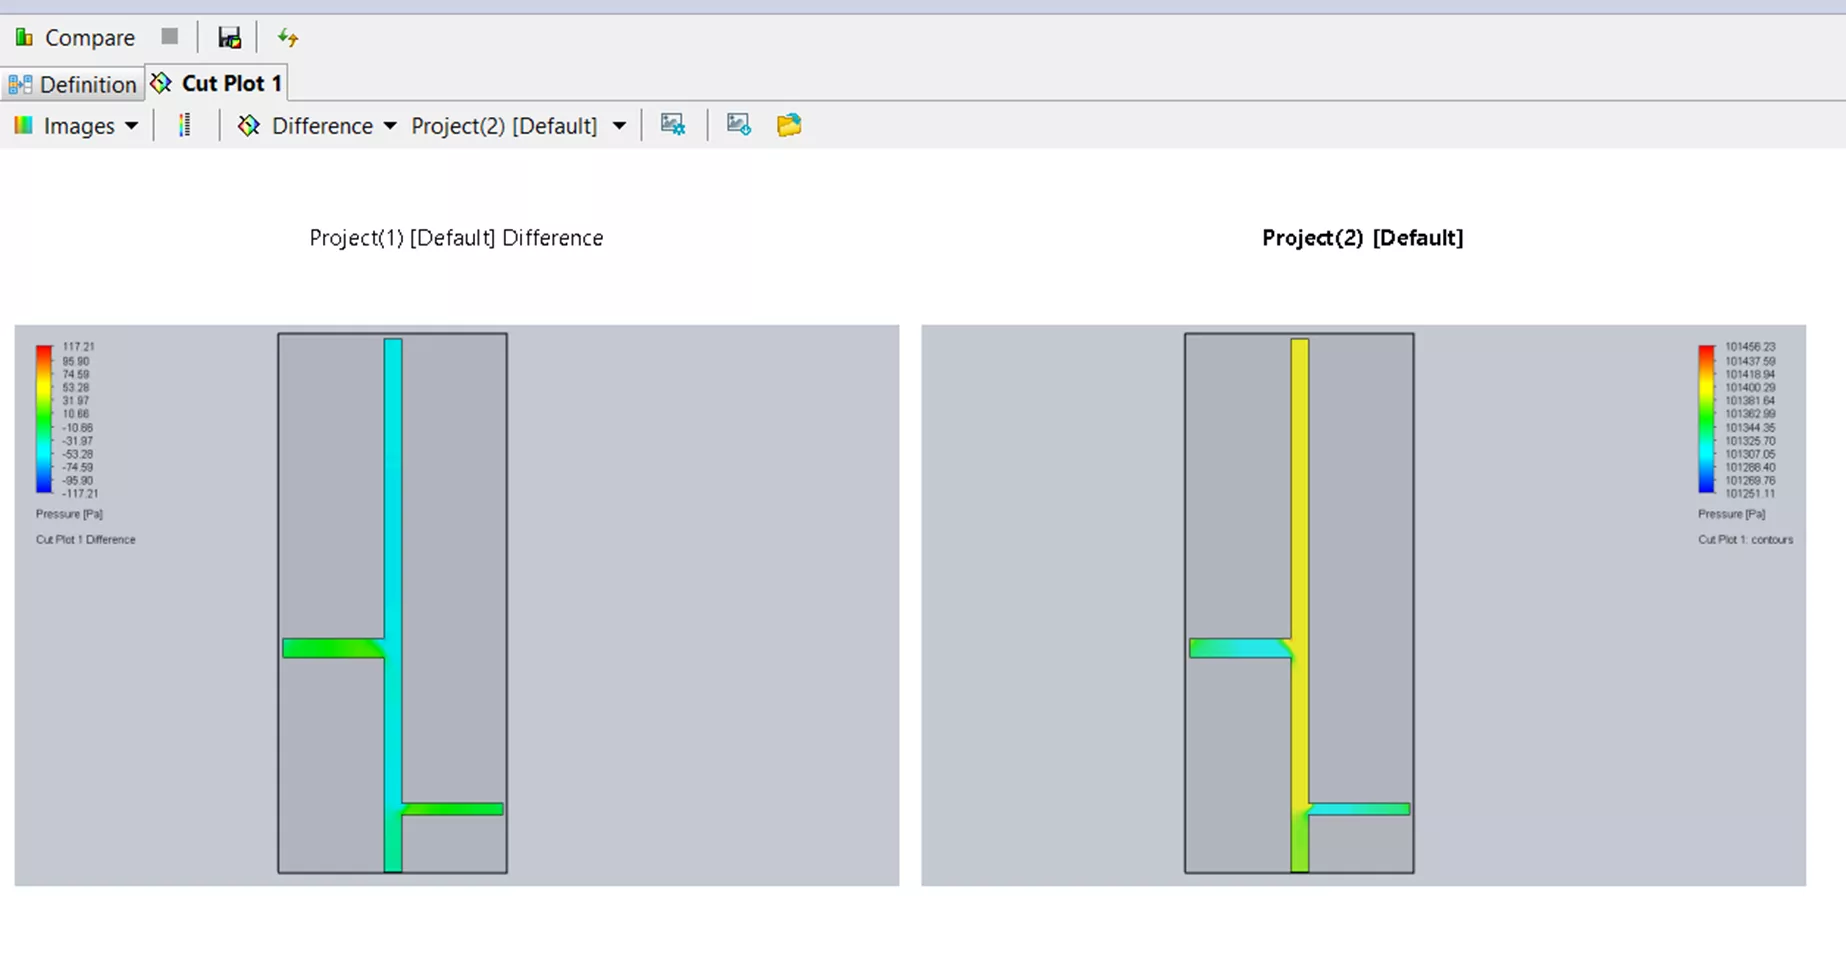
Compare Tool
Check the differences between different project results using the Compare tool. There are a few things that you can compare, including graphic plots, XY plots, goal plots, as well as point, surface, and volume parameters. This tool is located in both locations mentioned above.
EFD Scenes
Create an EFD scene of plots that are currently active including their settings. To get to the scene you must create a template or use any existing template. The template can be used to generate scenes for the Batch Results Processing tool, as mentioned above. Both the options Create Scene Template and Create Plots from Scene can be found in either the Tools or right-click menus.
With these tools, you can get all the information needed from the results files in whatever format works best for your situation. You can mix and match the results data for reports to make your data simple and easy to understand.
I hope you found this article explaining all the different SOLIDWORKS Flow Simulation results analysis tools helpful. Check out more tips and tricks listed below. Additionally, join the GoEngineer Community to participate in the conversation, create forum posts, and answer questions from other SOLIDWORKS users.
Related Articles
SOLIDWORKS Flow Simulation Free Surface and Gravity Dependency
SOLIDWORKS Flow Simulation Carbon Monoxide Flow Tracer
Winter Beehive Analysis Using SOLIDWORKS Flow & Thermal Simulation
SOLIDWORKS Flow Simulation 2024 - What's New

About Tashayla Openshaw
Tashayla Openshaw is a SOLIDWORKS Technical Support Engineer based out of our Headquarters in Salt Lake City, Utah. She earned her Bachelor’s degree in Mechanical Engineering from the University of Utah in 2018 and has been part of the GoEngineer family since February 2019.
Get our wide array of technical resources delivered right to your inbox.
Unsubscribe at any time.