SOLIDWORKS Simulation Energy Norm Error Plot
SOLIDWORKS Simulation first calculates displacements of all the nodes in the mesh. The strains are then calculated, and the last stresses for each element in the mesh are calculated. Stresses are calculated at specific points within each mesh called Gaussian or quadrature points.
After the Gaussian point has been calculated for an element, the program calculates the nodal stress for each element by extrapolation. Because different elements give different stresses even within a local area, it is common for a single node shared by multiple mesh elements to be given a different interpolated stress value by each of the elements it is shared by. Because of this, the program will average the values at a shared node by contributing elements.
Related >> SOLIDWORKS Simulation Gauss Points, Nodal, and Element Stress
After a lot of math, the Energy Norm Error is calculated using the interpolated stresses explained above. You can view these calculations for yourself by following this link.
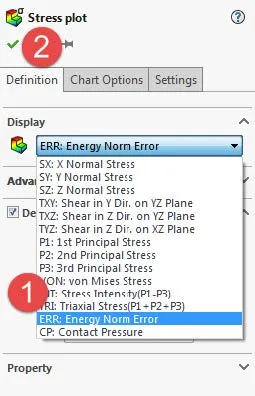
To turn the Energy Norm Error plot on right-click on the stress plot and click Edit Definition Now click the Display drop-down error and choose the ERR: Energy Norm Error plot and click the green checkmark.
How to Interpret the Energy Norm Error Plot Increase Stress Accuracy
The error calculated is a percent estimate of the error in energy norm and not stresses. If your mesh is homogeneous however you can assume the Energy Norm Error plot to represent stress errors as a percentage of the error. To decrease the mesh error in your model just increase the number of elements in the mesh by making each mesh element smaller and the mesh density finer.
In Figure 1, I set up a simple simulation using the default mesh setting for this geometry. As you can see the greatest error in this mesh is at the area of greatest displacement and stress. The highest error seen is around 17%. To decrease this error the local mesh density must be made finer than it currently is.
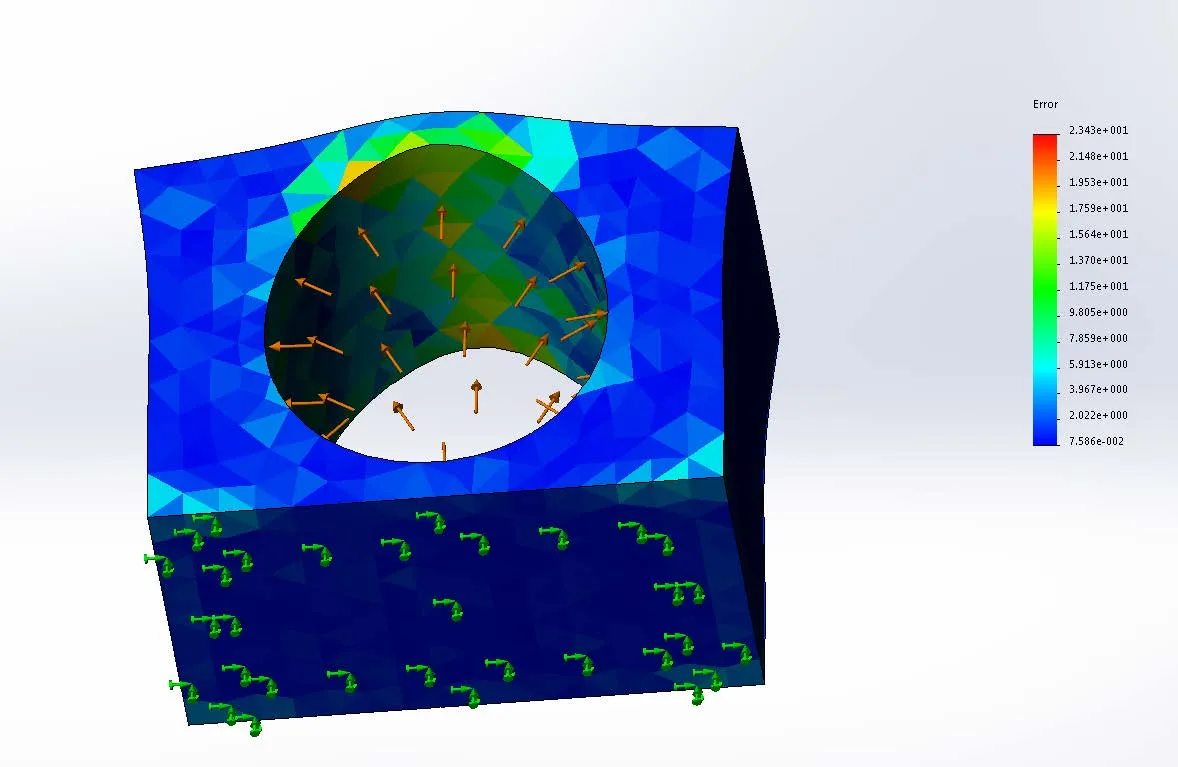
Figure 1: Energy Norm Error seen in the elements of the default mesh size.
After increasing the mesh density using the Apply Mesh Control command, and only increasing the mesh density in just the top area of this circle where the error is the greatest, the error seen in this area greatly decreases as you can see in Figure 2. The error in this area goes from 17% error to 1% error or less.
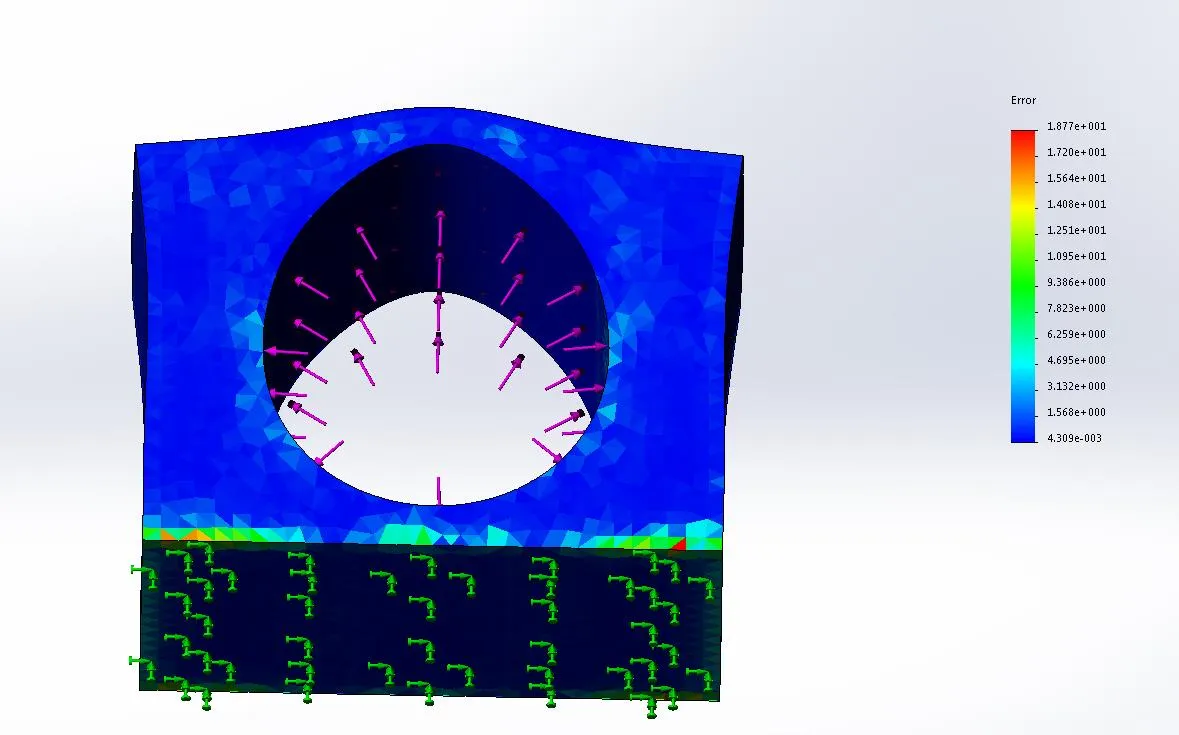
Figure 2: Energy Norm Error seen in the elements of a fine mesh size.
The greatest error that can be seen in this finer mesh simulation is at the corners of the model. Any errors seen at sharp corners as seen in figure 2 can be ignored because they are not accurate. In the rest of the model, the error seen is around 3% or less. It is up to the Simulation analyst to decide if this error percent is too high and needs to have further mesh refinement or not. It is generally suggested to only increase the mesh density in areas of high stress, or of great interest to the user.
More SOLIDWORKS Simulation Tutorials
SOLIDWORKS Simulation Results Export Options
Changing Units and Number Formats in SOLIDWORKS Simulation
SOLIDWORKS Simulation Tips: No Penetration Contact Set Setup
A Guide of Using Bearing Connectors in SOLIDWORKS Simulation

About Taran Packer
Taran is a SOLIDWORKS Simulation Technical Support Specialist at GoEngineer. He has a Bachelor’s degree in Biomedical Engineering from the University of Utah. Taran enjoys learning about different tools in SOLIDWORKS Simulation, Flow Simulation, and Plastics.
Get our wide array of technical resources delivered right to your inbox.
Unsubscribe at any time.