How to Create a 3DEXPERIENCE Dashboard with Analytics
The 3DEXPERIENCE platform offers a powerful way to set up a company-specific dashboard with analytics tools that will bring your engineering, design, and business data together in one place. This blog will walk you through creating a dashboard in 3DEXPERIENCE and integrating analytics, so you can start making data-backed decisions without leaving your collaborative workspace.
What is a Dashboard & Why Use Them?
In 3DEXPERIENCE, a dashboard displays content and resources for any activity you are a part of in your company. Every dashboard is made up of Tabs that contain widgets/applications (i.e., apps) that are used to perform everyday tasks. The apps listed in each of these tabs depend on what Roles you have been assigned to by your manager.
Dashboards in 3DEXPERIENCE provide:
- Centralized insight: Combines data from multiple apps and sources.
- Real-time updates: Analyze KPIs and trends as they happen.
- Cross-team visibility: Shares insights between engineering, manufacturing, and management teams
- Better decision-making: Back your decisions with live analytics, not static reports.
Whether you’re tracking design progress, project milestones, or supply chain metrics, dashboards help keep everyone on the same page.
Creating a Dashboard
Step 1: Access the Dashboard App
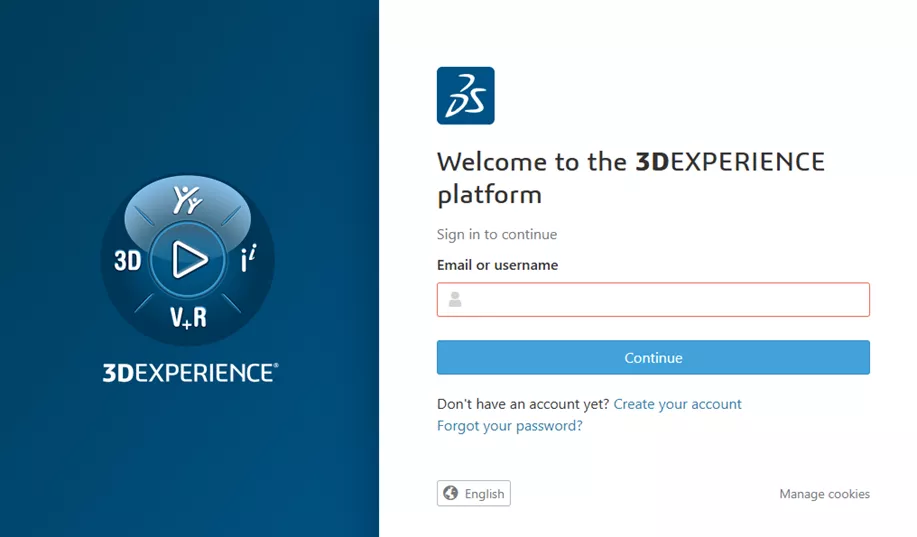
- Log in to your 3DEXPERIENCE platform via the web.
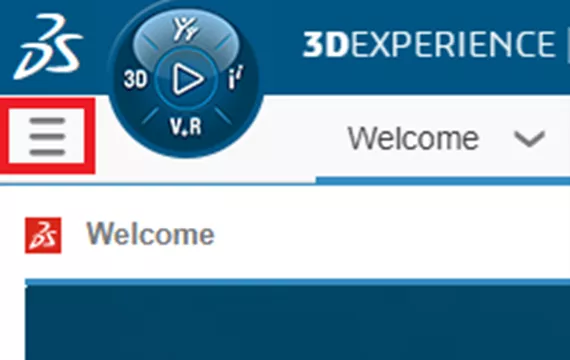
- In the top-left corner under the Dassault Systèmes logo, click the Menu button.
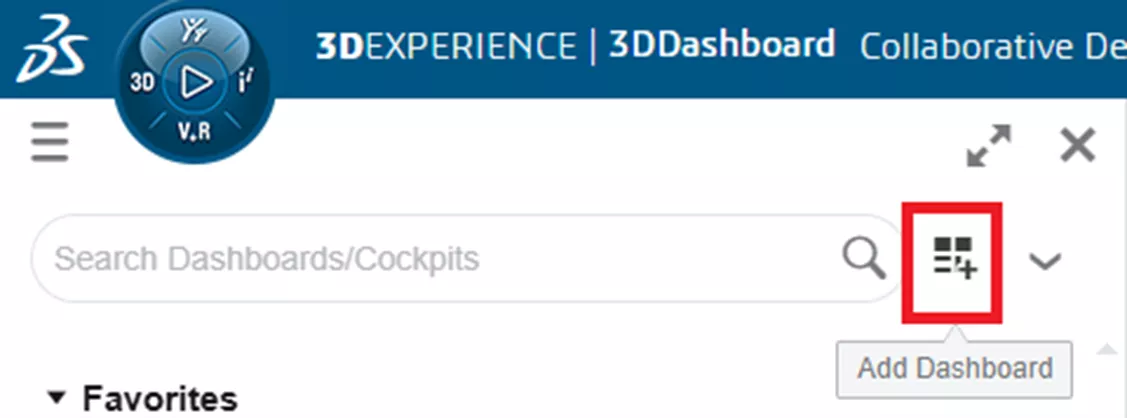
- Click Add Dashboard to create a new workspace.
- Enter a Name and Description for your new dashboard.
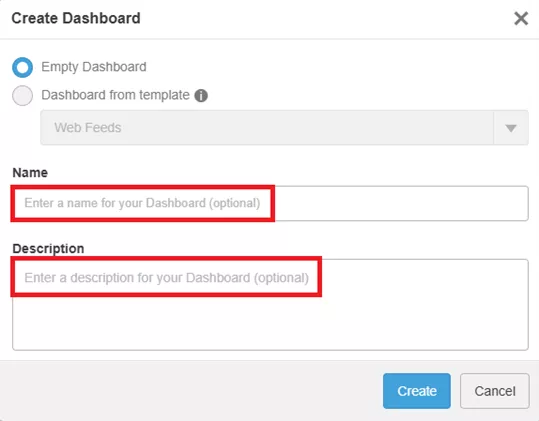
Note: You can create multiple dashboards for different needs (e.g., one for project tracking, another for quality analytics, and one for executive KPIs).
Step 2: Adding Tabs
Tabs within a dashboard serve to organize Widgets (Apps) into logical groupings, enhancing focus and efficiency for specific tasks or areas of work. Each tab acts like a separate page within the dashboard, allowing users to arrange and access relevant apps and content efficiently.
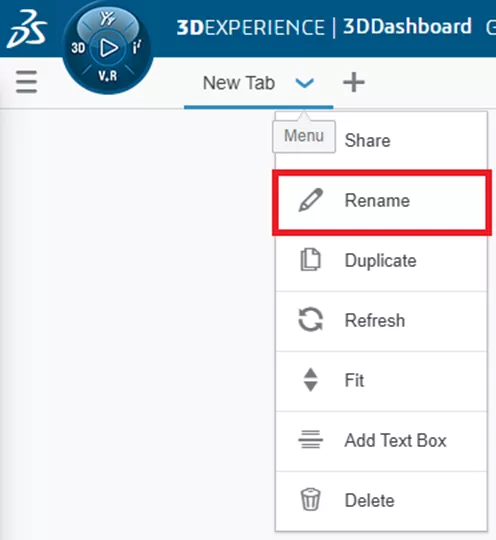
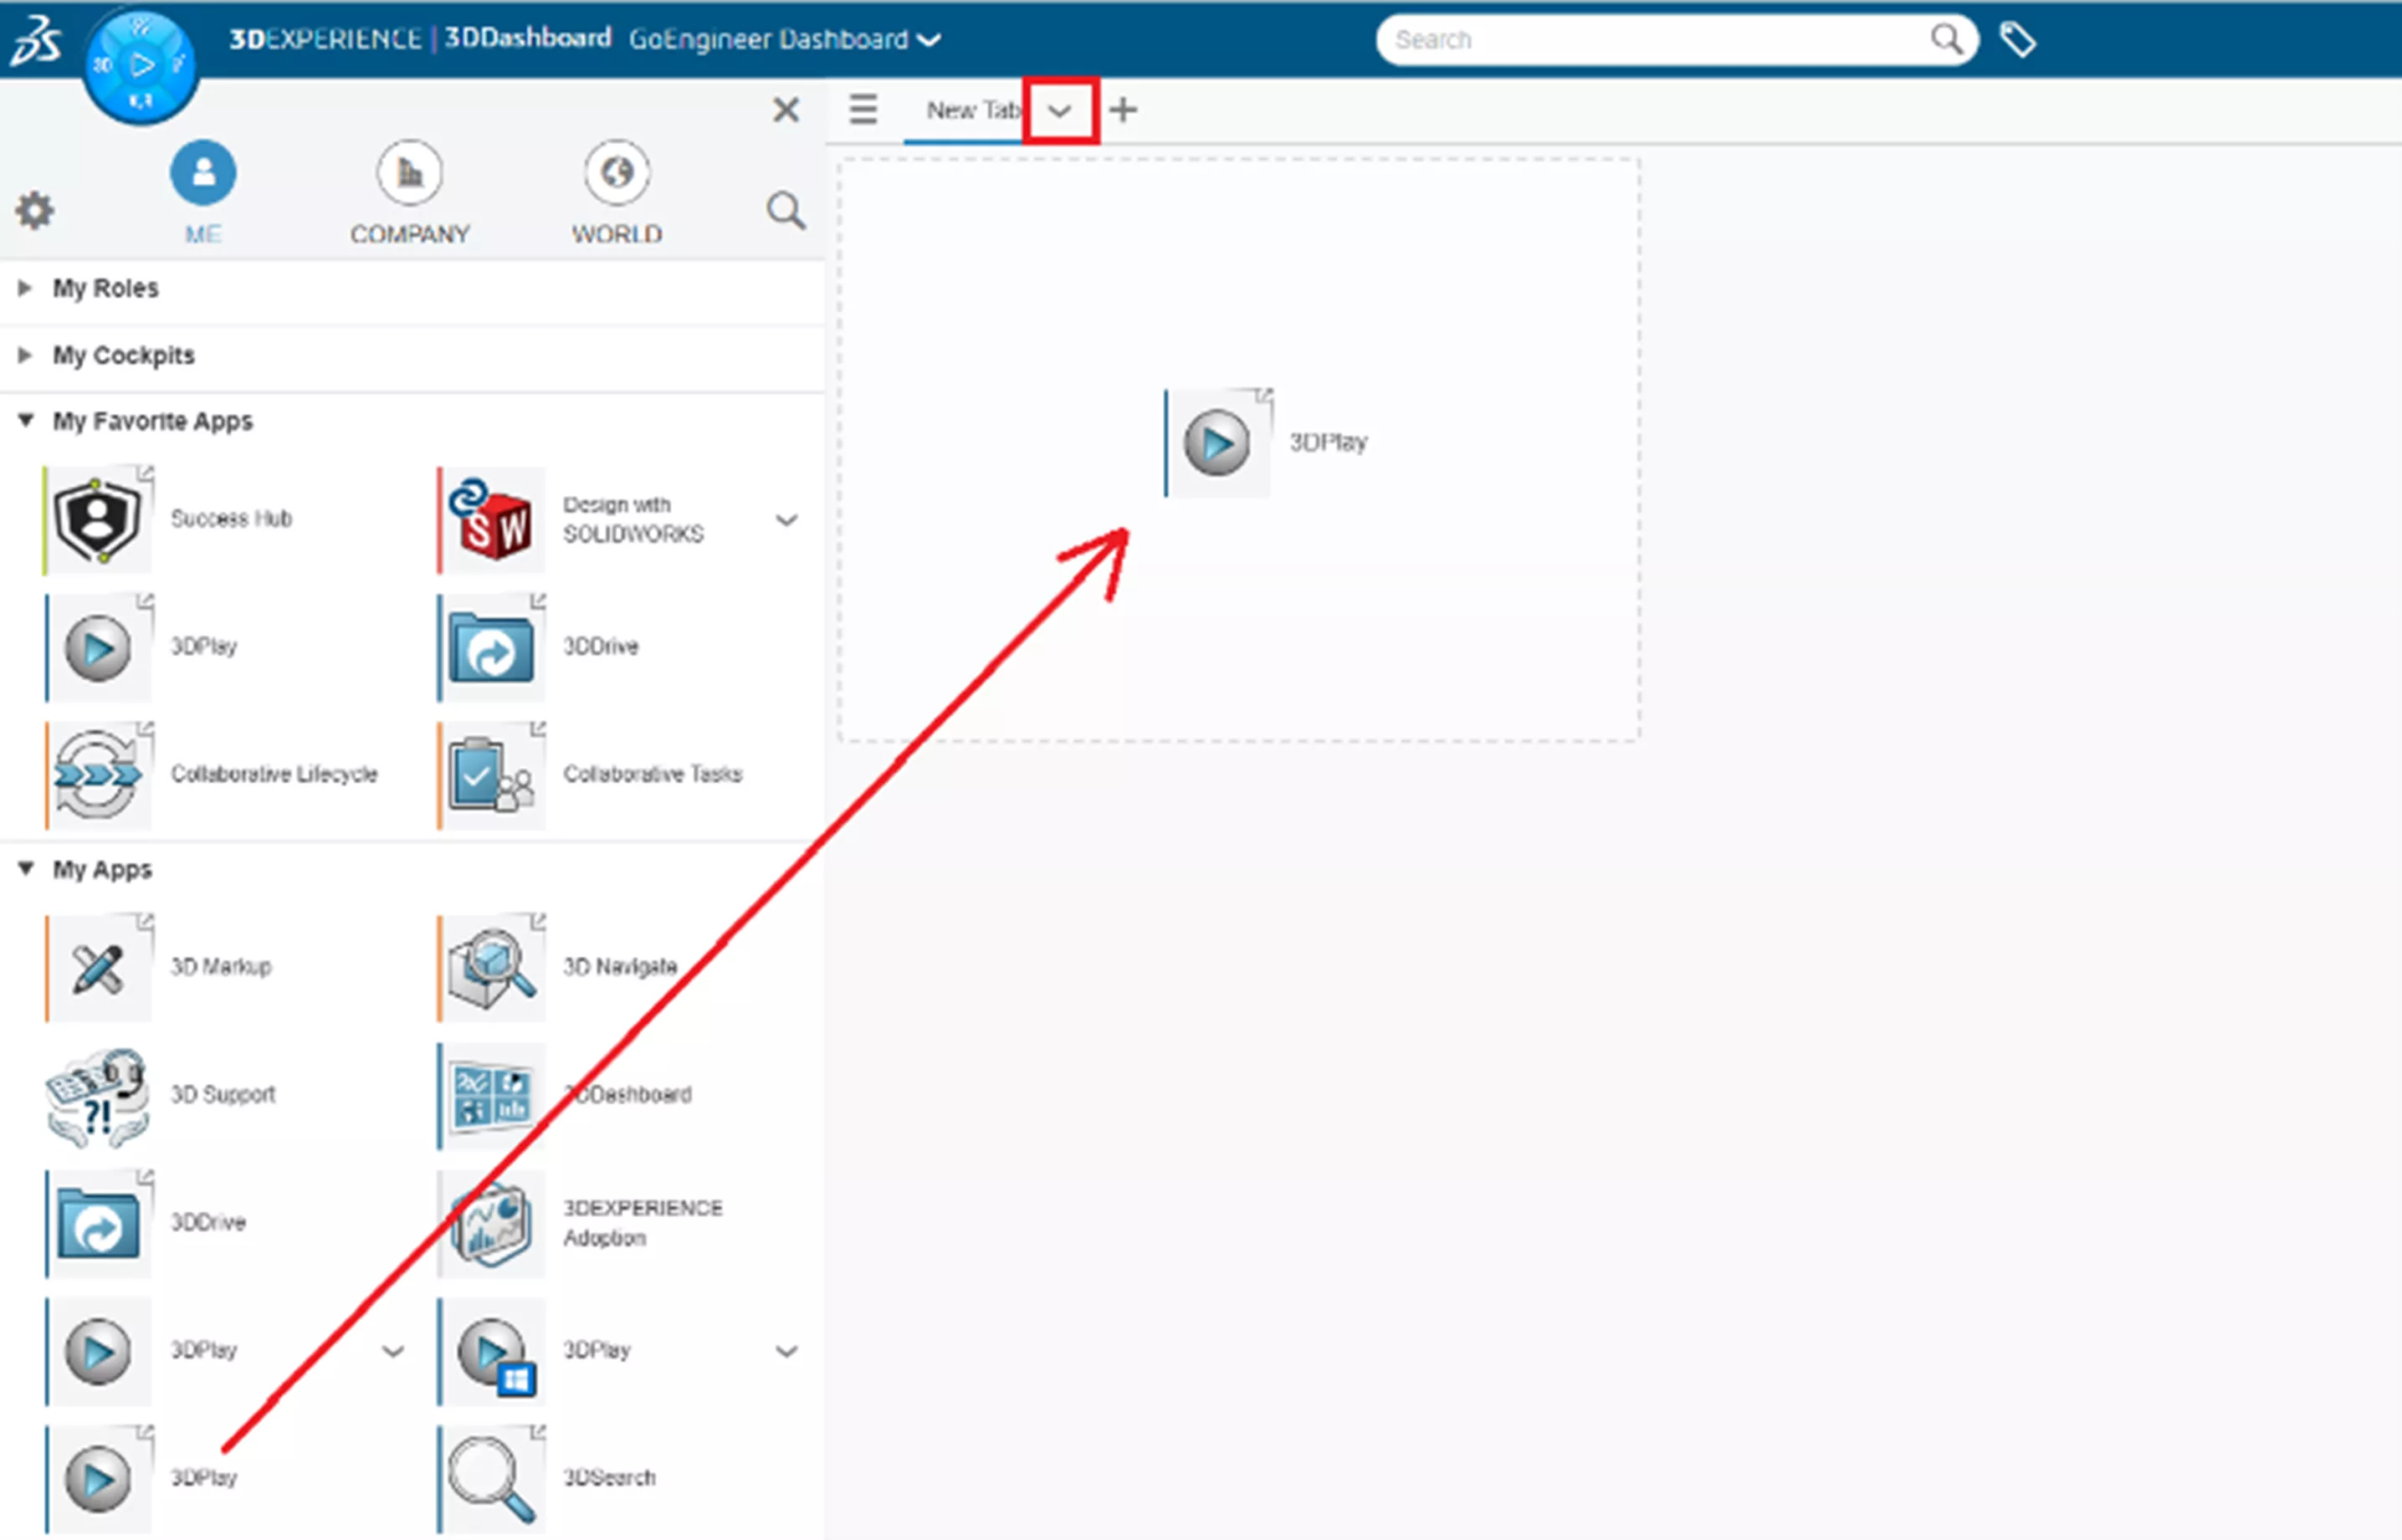
- With your newly created dashboard, you will find a single New Tab. Select the pull-down menu to rename the tab.
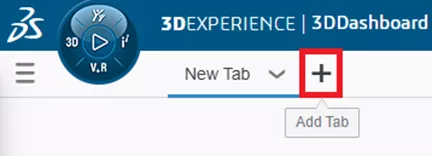
- To add additional tabs, select the + symbol.
Step 3: Adding Widgets/Apps
Widgets are the building blocks of your dashboard. They can display data from internal apps, external sources, or custom feeds.
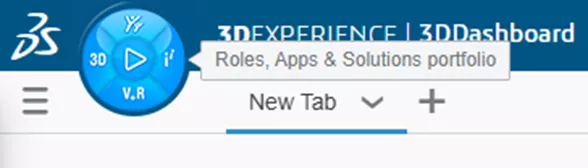
- Click on the blue Compass (Roles, Apps & Solutions Portfolio) to access your Roles and Apps.
- Within the Compass menu is a section that contains all the Roles that have been assigned to you, and below that, a section that contains all the Apps belonging to those Roles. To filter the Apps, simply click on one of the Roles.
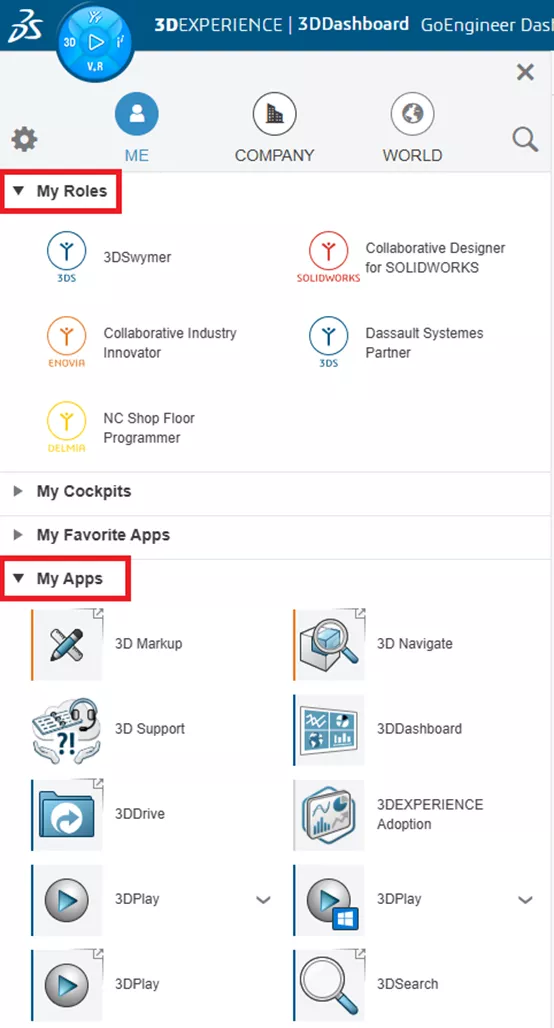
- Locate the Apps with the arrows located in the upper right corner of the App icon.
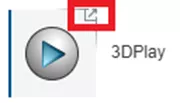
These are the apps that can be added to your tabs within your dashboard. Choose from options such as:- 3DPlay: Embeds live 3D models for quick reviews.
- Analytics App: Displays KPIs, charts, and metrics.
- RSS feeds: Pulls in industry or company news.
- Webpage App: Embeds third-party websites for accessing analytics or BI tools.
- Drag and drop the individual Apps from the My Apps window onto the active tab of your dashboard. Arrange them using drag-and-drop for a clean, logical layout, or choose the Fit option under the pull-down menu located right next to the tab name.
Step 4: Connect to Analytics Sources
To make your dashboard more than just a collection of widgets, you’ll want data-driven analytics.
Common ways to integrate analytics in 3DEXPERIENCE:
- ENOVIA Project Management: Track tasks, deadlines, and resource usage.
- DELMIA Manufacturing KPIs: Monitor production rates, downtime, and quality scores.
- NETVIBES Data Intelligence: Aggregate and visualize data from internal systems, IoT devices, and the web.
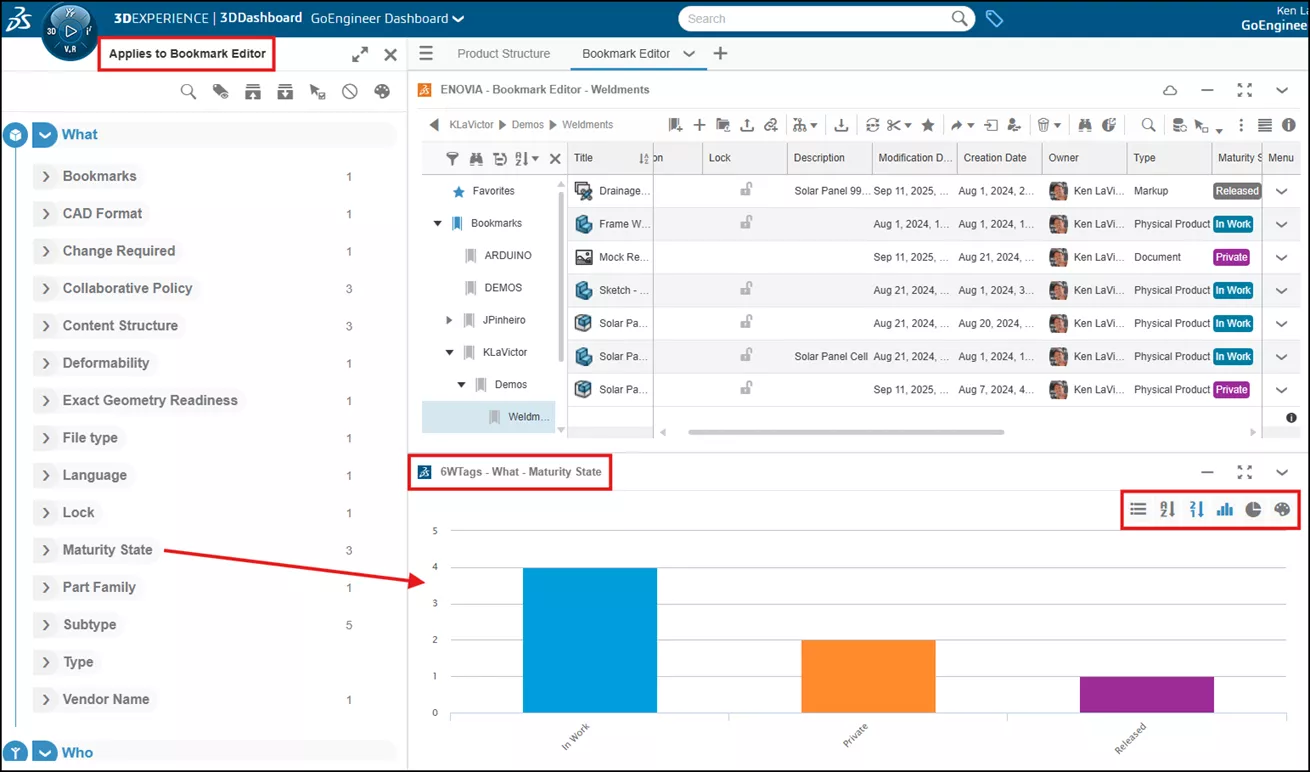
Example: Using 6WTags for Adding Analytics
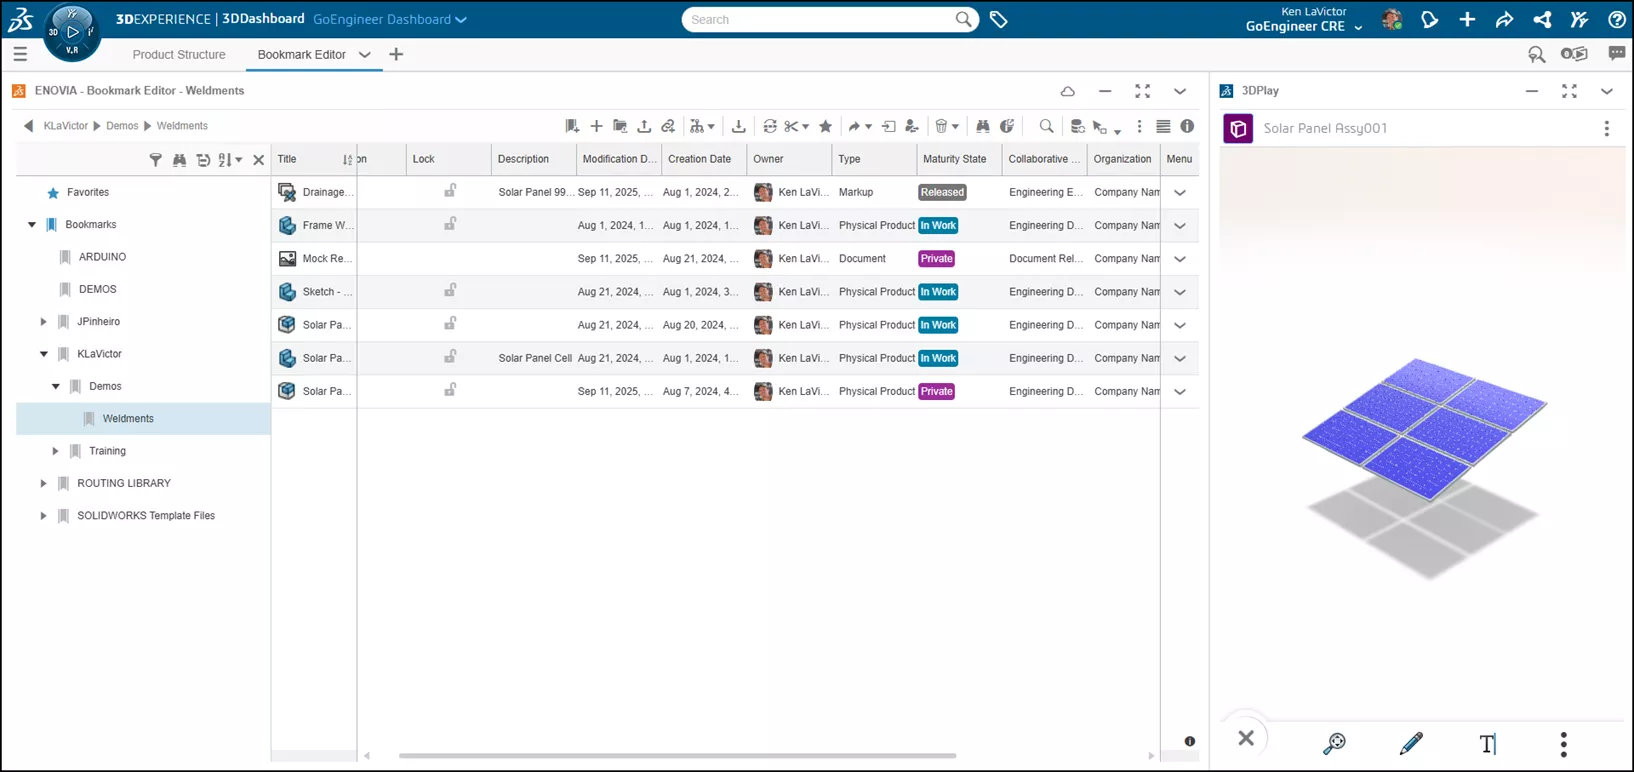
- Select a tab on your dashboard to which you want to add some analytics. In this example, I have selected my Bookmark Editor tab (which contains all my bookmarks for all my files) and 3DPlay (so I can quickly view the files).
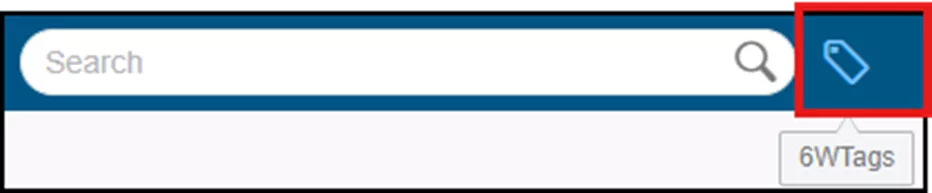
- Use the 6WTags button at the top of your browser window to access your analytics options.
- On the window that opens on the left of your browser, select the analytic type and drag it to the bottom of your Bookmark Editor window. In my example, I have chosen Maturity State so that I can see the current workflow status of each component in my project. Subsequently, I can choose the type of view (Pie Chart, Bar Chart, etc.) on the right of the 6WTags window.
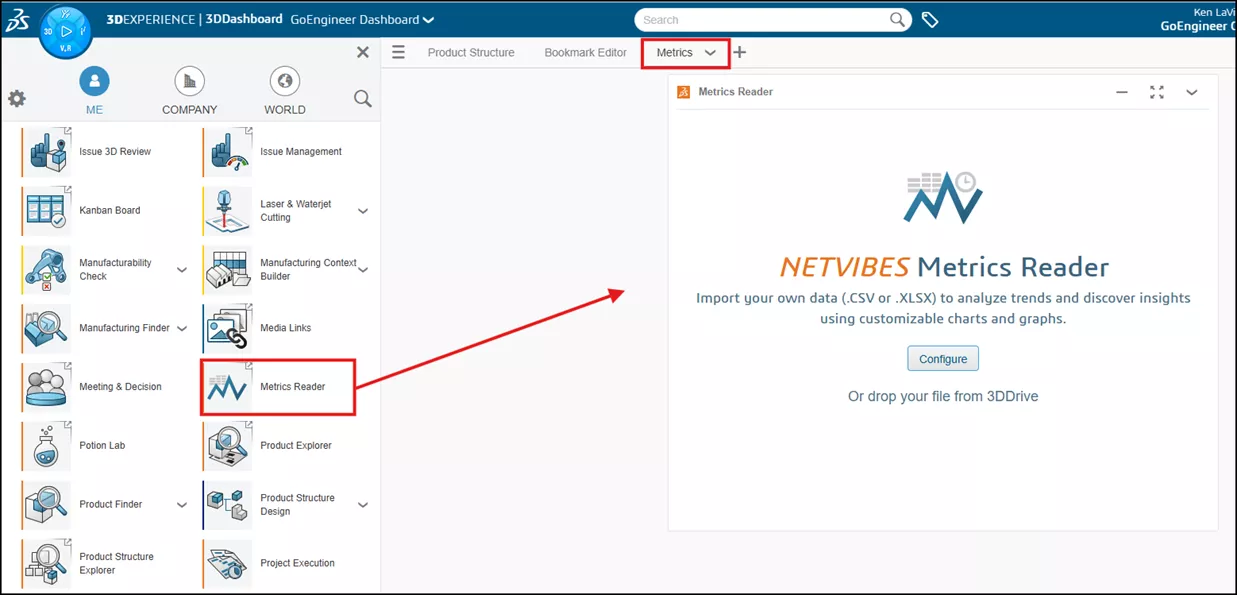
Example: Using NETVIBES Metrics Reader for Analytics
- After creating another Tab on your Dashboard, go to the blue Compass menu to access My Apps once again. Locate the Metrics Reader app and drag it to this new tab. Again, you can select the down arrow next to the tab name (Metrics in this example).
- Drag and drop your file from 3DDrive or use the Configure button to help you with importing your .CSV or .XLSX files.
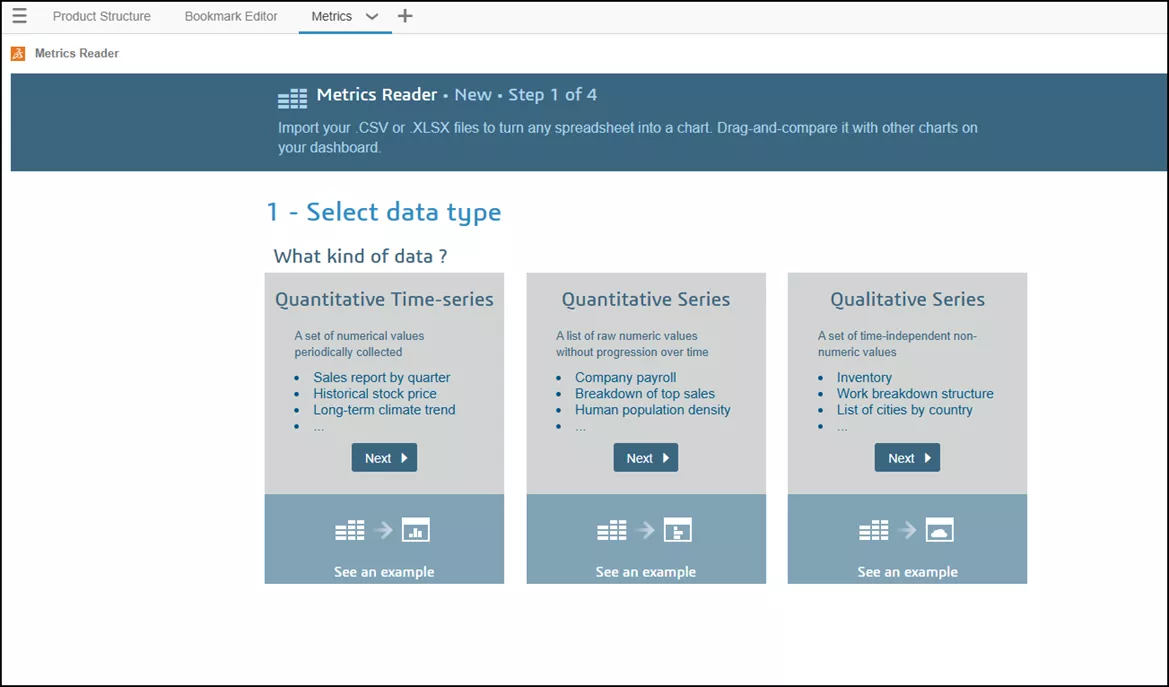
- After completing the four steps, you will then have quick access to your company’s data.

Example: Using NETVIBES Feed Reader to Access Your Favorite RSS Feeds
- After creating another Tab on your Dashboard, go to the Blue Compass menu to access My Apps. Locate the Feed Reader app and drag it to this new tab. Again, you can select the down arrow next to the tab name (News Feeds in this example), and choose Fit to expand the window.
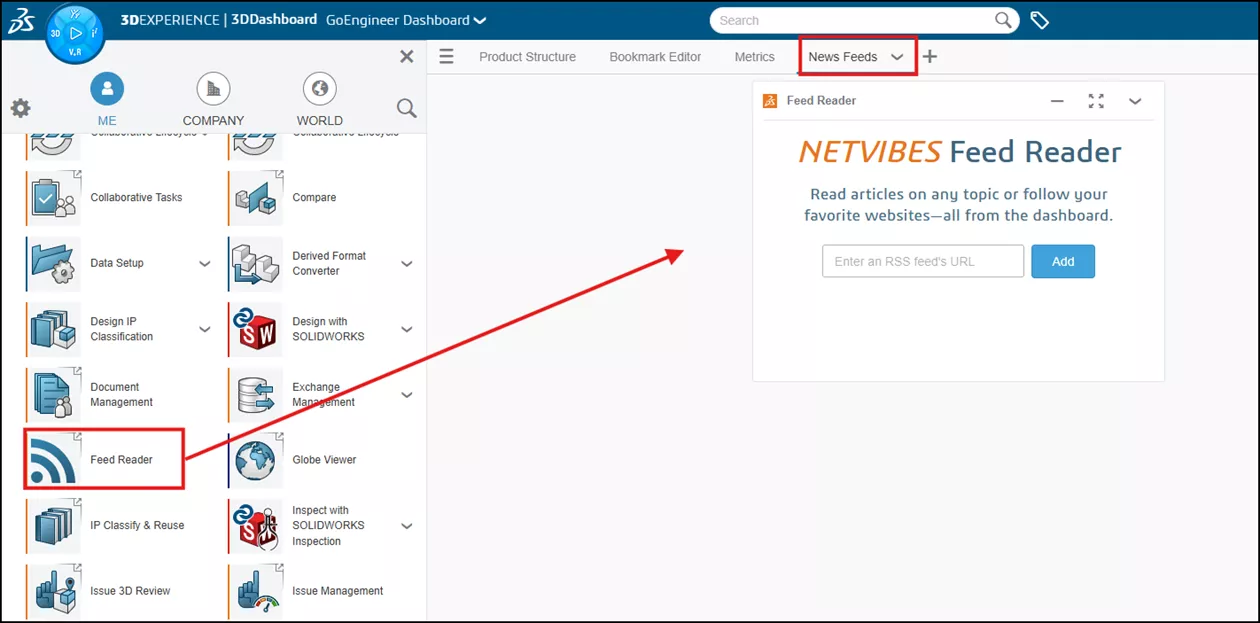
- Copy and paste your favorite RSS feeds' link address into the window and click Add. From here, you can click on the View button in the upper right corner to customize how you want to view the display in your Feed Reader window. In this example, I chose Mosaic.

Example: Using Web Page Reader to Access Your Favorite Websites
-
- After creating another Tab on your Dashboard, go to the Blue Compass menu to access My Apps. Locate the Web Page Reader app and drag it to this new tab. Again, you can select the down arrow next to the tab name (GoEngineer in my example below), and choose Fit to expand the window.
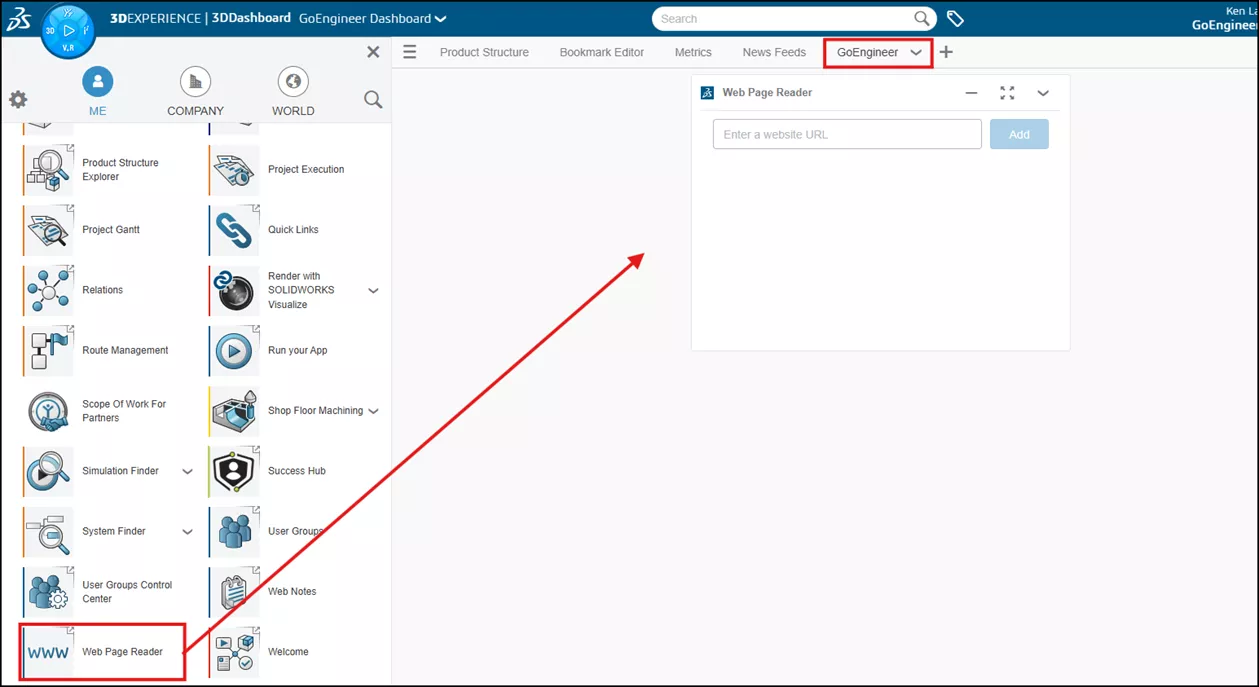
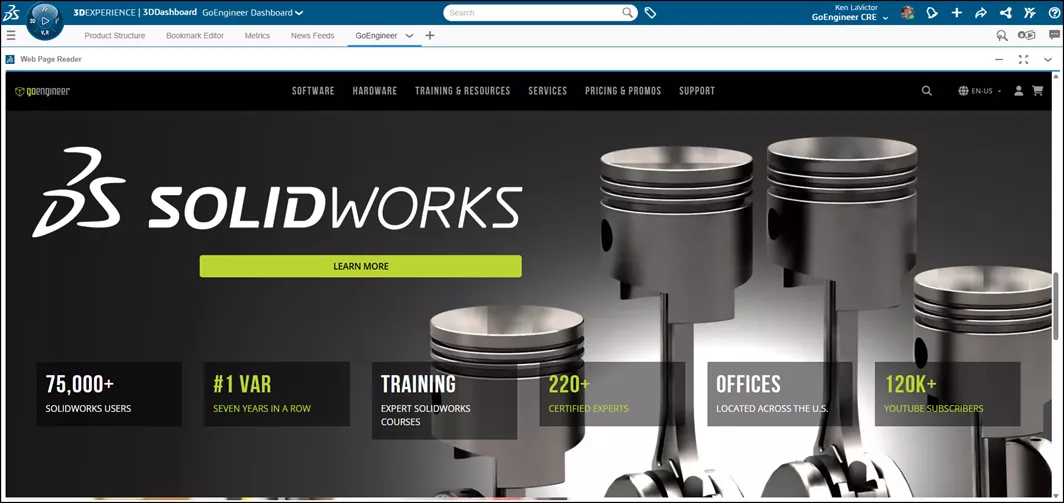
- Copy and paste your favorite webpage URL into the window and click Add. This might be a good place to add GoEngineer’s website so you can access all your GoEngineer information right inside your 3DEXPERIENCE browser.
- After creating another Tab on your Dashboard, go to the Blue Compass menu to access My Apps. Locate the Web Page Reader app and drag it to this new tab. Again, you can select the down arrow next to the tab name (GoEngineer in my example below), and choose Fit to expand the window.
Step 5: Share & Collaborate
Once your dashboard is ready, you can share it with others in your company.
- At the top of your 3DEXPERIENCE window, select the down arrow next to your Dashboard’s name, and then Share.
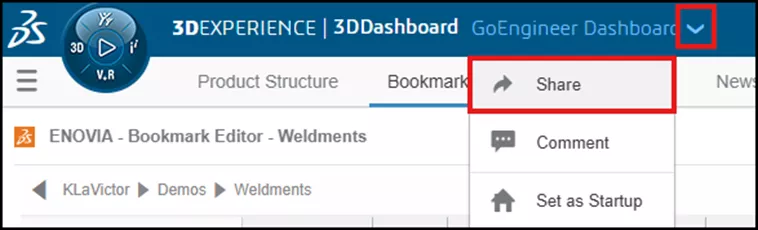
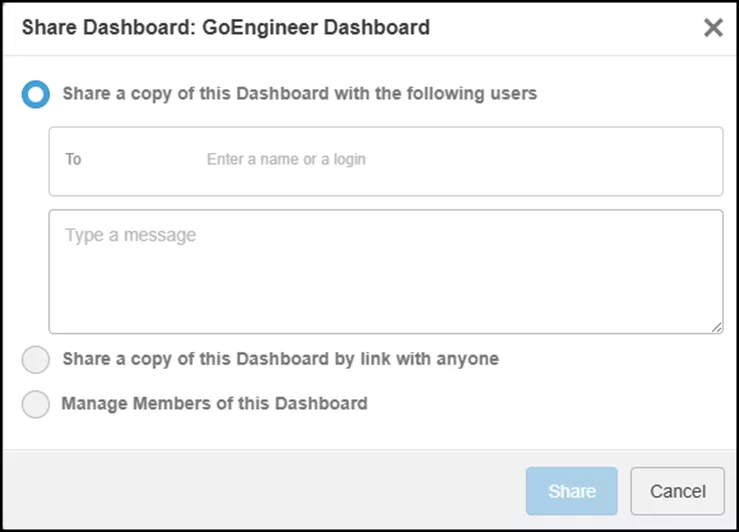
- Choose whether to share it with anyone or specific users, as well as manage the members of the dashboard.
This ensures decision-makers have access without overwhelming them with unnecessary details.
Dashboard Best Practices and Final Thoughts
There are plenty of best practices for effective dashboards in 3DEXPERIENCE. Below are just a few of these practices.
- Keep it focused: Don’t overload with too many metrics.
- Update regularly: Ensure data sources are live or refreshed.
- Tell a story: Arrange widgets so they lead viewers through insights logically. Like any process, the daily tasks (and subsequent tabs) should read left to right.
- Use visuals wisely: Charts and colors should enhance clarity, not distract.
Creating a dashboard with analytics in 3DEXPERIENCE isn’t just a technical task; it’s about enabling faster, smarter, and more collaborative decision-making. By combining live data, interactive apps, and role-based sharing, you can turn your dashboard into a strategic control center for your projects and operations.
I hope you found this article explaining setting up a 3DEXPERIENCE dashboard with analytics helpful. Check out more tips and tutorials listed below or on our 3DEXPERIENCE YouTube Channel. Additionally, check out the GoEngineer Community, where you can create forum posts, join design contests, and answer questions from other 3DEXPERIENCE platform users.
Related Articles
Assign 3DEXPERIENCE Roles & Manage Members
Exporting Derived Outputs from the 3DEXPERIENCE Platform
3DEXPERIENCE - Release Assembly and All Related Files

About Ken LaVictor
Ken LaVictor is a Sr. Application Engineer based out of Pleasant Ridge, MI. He earned his BSME, as well as his Master's of Science degree in Systems Engineering. Since joining the VAR channel in 2004, Ken has earned his Elite AE, SOLIDWORK Expert, and Simulation Expert certifications. In addition to supporting sales, Ken also teaches the SOLIDWORKS and Simulation training courses, assists with technical support, and conducts Application Mentoring Sessions (AMS).
Get our wide array of technical resources delivered right to your inbox.
Unsubscribe at any time.