Fastest Way to Cool a Hot Dog: SOLIDWORKS Flow Simulation Study
Have you ever cooked a hot dog and then burned your mouth because you couldn't wait? I have, and I then wondered, "what is the best way to orient a hot dog so it cools down the fastest?" National Hot Dog Day is July 20th, so we might as well find the solution. There are three methods to find these types of results:
- Use an established formula
- Experimentation
- Simulation
The best method depends on your situation. This post shows how SOLIDWORKS Flow Simulation is a viable solution to manage heat transfer between a solid body and a fluid. Here, the hot dog is an analog for other solid bodies where convection is an essential heat transfer method. It can be a powerful tool to provide results and guidance even when accepted analytical solutions may miss the mark.
I started by modeling a simple cylinder with rounded ends and ran a study measuring the body's average temperature as it cooled over 15 seconds. I set this study to run on two orientations (shown below).
I created a custom material with thermal properties I found on the web for hot dog meat. While this works for a hot dog analysis, you can use SOLIDWORKS Flow Simulation to achieve similar and better results for a myriad of cooling problems.
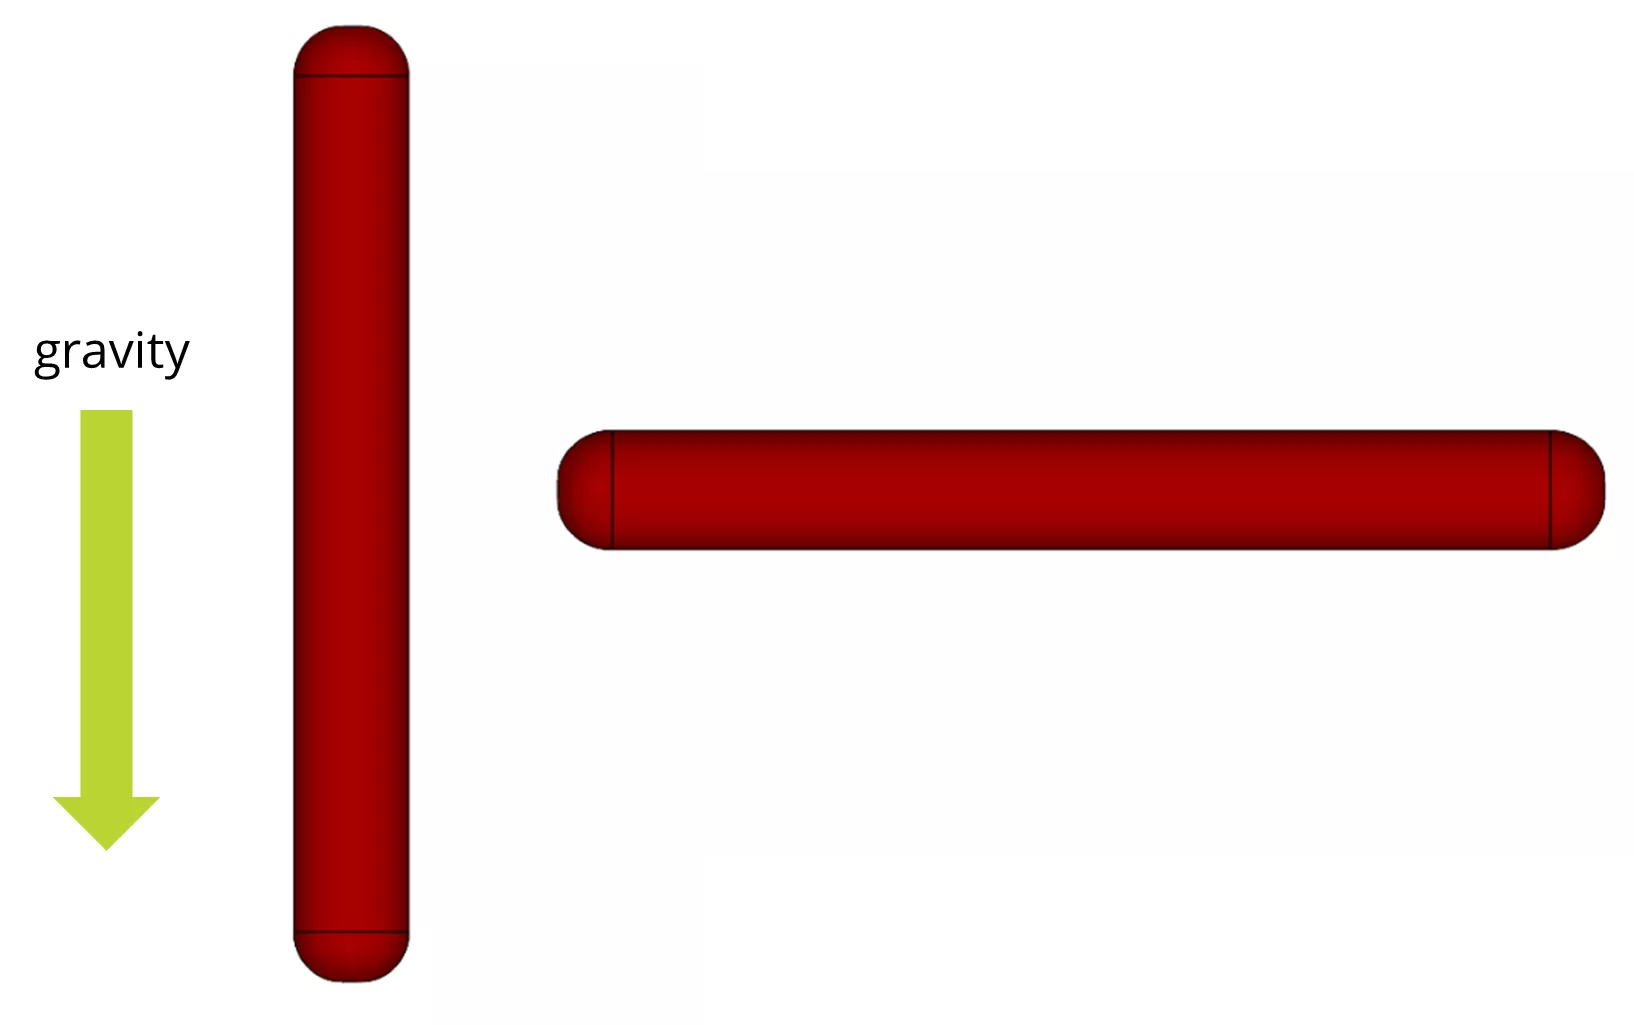
Figure 1: Orientations of the straight hot dog and the gravity vector
I then modeled a second hot dog with a slight bowing to simulate the shape of many hot dogs after they are cooked. I ran the study on the bowed hot dogs in the orientations shown below. I've shown the direction of gravity's pull on both figures as this plays a crucial role in fluid behavior during natural convection.
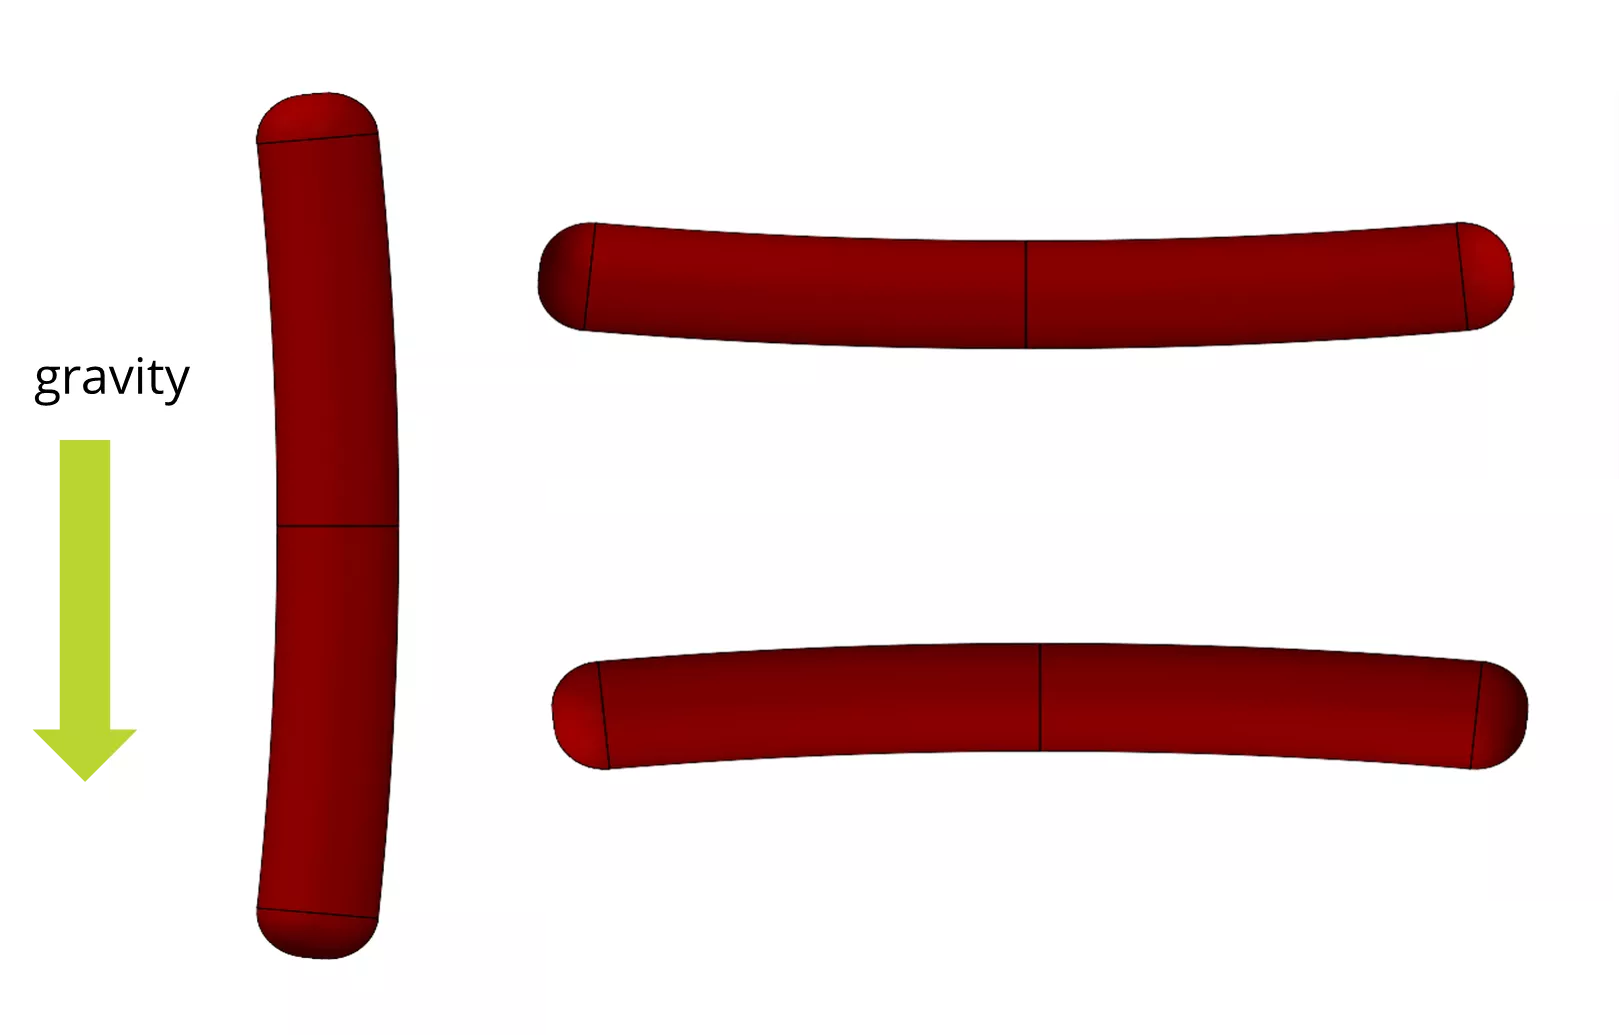
Figure 2: Orientations of the bowed hot dog and the gravity vector
A Quick Review of Natural Convection
In general, natural convection is a heat transfer method where a solid body is in contact with a fluid of a different temperature. The solid body alters the temperature of the fluid it contacts and causes the fluid to change volume. This change in volume alters the density causing the fluid to change buoyancy and either sink or rise.
Here, we're looking at a solid body (the hot dog) that is hotter than the fluid (air) around it. This temperature change causes the air around the hot dog to become hot and expand, which lowers the density and creates buoyancy. This warm, buoyant air rises, pulling the cool air up to replace it. The cool air is warmed, and the cycle continues. Hopefully, the GIF here can help.
Figure 3: A GIF showing step-by-step convection. In reality, both phenomena occur simultaneously
Using Non-simulation Solutions
We had two non-simulation solution methods to find the best orientation.
The first was to use existing and established formulae (either empirical or analytical) to calculate the answer. From these formulae, you can generate quick and nearly free answers, but these answers may not catch some of the specifics of your problem.
The second was experimentation. Experimentation can give you precise solutions for your specific problem but comes with high financial and time costs, especially when considering multiple versions and prototypes.
Spoiler Alert. Results From Formulae and Experimentation
In brief, I used the formulae standard in heat transfer (Prandtl number, Rayleigh number, Nusselt number, etc.) to find which orientation would be better. The answer:
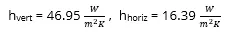
The vertical hot dog had a higher convective heat transfer rate (i.e., it cooled faster than the horizontal hot dog). Confident in my answer (partly because it matched my gut), I looked at the results of a physical experiment done at a university lab.
The experiment yielded a different result; there was no measured difference in the total cooling times. I double-checked my calculations to no avail; I got the same answers as before. The established standard formulae predicted one outcome, and an experiment disproved it.
Enter SOLIDWORKS Flow Simulation
For many cases, the established formulae are sufficient. But not for this case. The reason is (not to be too reductionist), that fluids are complicated. 3D effects and non-ideal cylinders allowed vortices to repeatedly bring cool air down on the hot dog and increase the cooling rate, as shown here.
Another significant benefit of simulating vs. using formulae or experimenting is the ability to quickly test other, non-ideal shapes. Hot dogs tend to bend when cooked, for which the empirical and analytical formulae are insufficient to handle. Additionally, the time and financial costs become a concern when multiple experiments need to be conducted.
SOLIDWORKS Flow Simulation was able to run five studies. We only have heat transfer formulae for two of the five orientations, and when repeating the simulation for the other shapes, I simply copied the first study's settings and hit run.
The results of the simulation are shown here.
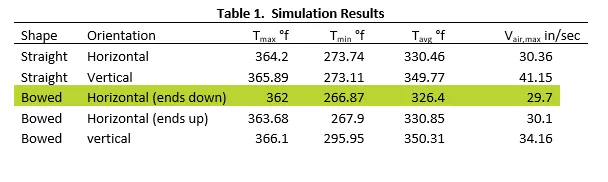
I've highlighted the orientation and shape that cooled down quickest. After only 20 seconds, all three horizontally oriented hot dogs' average temperature was approximately 20° F cooler than the vertical orientation.
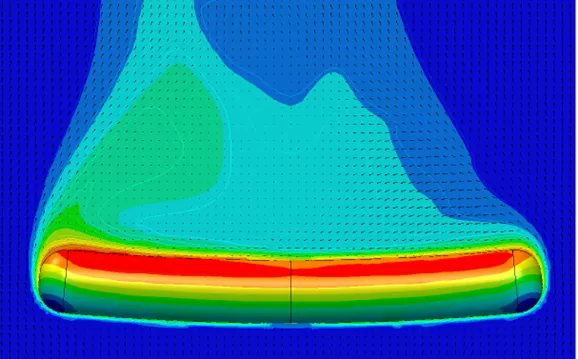
Figure 5: Flow visualization of the best-case orientation of a hot dog. Temperature contours show the asymmetric convection behavior once the flow is fully developed and eddies are clearly shown
Flow Visualization results
Figure 6: Flow visualization of a bowed up orientation of a hot dog. Temperature contours show the asymmetric convection behavior once the flow is fully developed
Figure 7: Flow visualization of a straight horizontal orientation of a hot dog. Temperature contours show the asymmetric convection behavior once the flow is fully developed
SOLIDWORKS Flow Visualization Results
The surface temperature of the hot dogs after 15 seconds of cooling is shown below. In both cases, the coldest part of the hot dog is the lowest part, which was repeatedly exposed to the cooler air as the warm air moves up due to natural convection.
Figure 8: Surface temperature of the straight hot dog after 15 seconds of cooling
We also have the bowed hot dog orientations with the surface temperature plots below. Of particular interest is the asymmetric temperature distribution on the horizontal hot dog.
Figure 9: Surface temperature plots on bent hot dogs in the tested orientations. Of particular note are the assymetries of the surface temperatures on the horizontal orientations
Conclusion
Of the ways to find a solution to this type of heat transfer problem, SOLIDWORKS Flow Simulation allowed me to test not only the two orientations in the initial question, but easily and quickly test several others. The formulae used in heat transfer are a good place to start, but it is clear that the information we find from them is insufficient and that the results depend largely on assumptions about the body and flow that may not be valid. While guaranteed to give us actual results, experimentation can be expensive and time-consuming.
SOLIDWORKS Flow Simulation allows us to try multiple designs in succession and identify a better start point for prototyping and experimentation.
Learn More About SOLIDWORKS Flow Simulation
Understanding Flaps Using SOLIDWORKS Flow Simulation Parametric Study
SOLIDWORKS Flow Simulation Convergence Solver Quick Tip
SOLIDWORKS Flow Simulation Transient Pressure Pulse Study
SOLIDWORKS Flow Simulation Fluid Mixing Tutorial
Understanding the Tesla Valve Using SOLIDWORKS Flow Simulation

About Andrew Smith
Andrew Smith is an Application Engineer and Simulation Specialist at GoEngineer. Andrew earned his bachelor’s degree in mechanical and aerospace engineering and his master’s degree in mechanical engineering at Utah State University, where he wrote his thesis on baseball aerodynamics and discovered the Seam-Shifted-Wake. He is passionate about engineering, fluid dynamics, and simulation and loves helping others find the best engineering solution for their problem. When not working, Andrew can be found reading crag-side or mountain biking with his family.
Get our wide array of technical resources delivered right to your inbox.
Unsubscribe at any time.