Understanding Flaps Using SOLIDWORKS Flow Simulation Parametric Study
Purpose of Flaps on Fixed Wing Aircraft
During takeoff and landing, fixed-wing aircraft often deploy flaps to increase lift. The lift required is a function of multiple variables, and the maximum possible lift is not necessary for most takeoffs and landings. However, understanding the relationship between flap deflection and lift is essential for aircraft design to reduce the speed and runway length needed at takeoff and landing. SOLIDWORKS Flow Simulation is a powerful tool that can aid and streamline the design process by calculating the fluid behavior around a part or assembly.
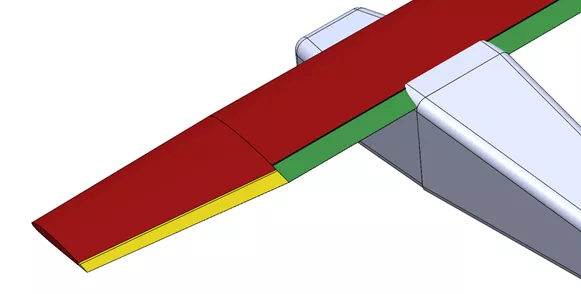
Figure 1. The basic layout of a Cessna 172 with its flaps shown in green
How flaps work
Flaps are high lift devices, typically located on the aft, inboard section of the main wings. When flaps are deployed (deflected and/or extended), they increase the curvature (called camber) and often the wing’s angle of attack and cord length, resulting in an increased pressure differential and lift.
There are several flap types, but the most common are the split-flap, the slotted flap, and the fowler flap. For the sake of this study, I can briefly discuss the function of slotted flaps.
Slotted flaps allow a certain portion of the air to pass through a slot at the flap’s leading edge. The space narrows as the air passes through it, accelerating the air and lowering the pressure thanks to Bernoulli’s law. If you get the window seat on your next plane ride and happen to be in behind the wings, you’ll be able to see a set of compound slotted fowler flaps that generate even more lift.
Setup
This study consisted of two parts. For the first part, I used SOLIDWORKS to model a NACA 2412 airfoil with a cord length of 1.63m with no flaps to generate a CL (lift coefficient) and CD (Drag Coefficient) vs. α (angle of attack) plot.
I did this to verify that our results matched expected results and to have a base comparison. I created a parametric/what-if analysis study and measured the lift and drag from an α of -15° to 30° (past the typical stall α of 15° to 20°).
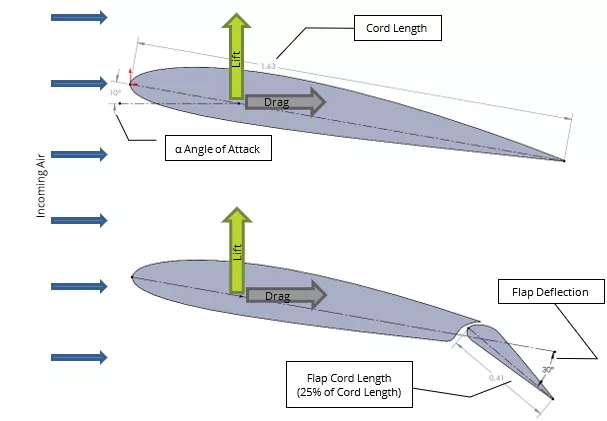
I modeled the same NACA 2412 airfoil for the second part but separated the airfoil into the main airfoil section and the flap. Again, I used a root cord length of 1.63m with a flap cord fraction of 25%. This roughly represents the root section of a Cessna 172 wing.
I selected the single slot flap-type to represent the 172’s flap design. I designed this simulation study to run with a 10° angle of attack relative to the main cord.
I used the 2D analysis simplification to reduce computation time. Ideally, I would run the study on an entire aircraft or at least a whole wing; such a study is beyond the scope of this blog post. As it is, the analysis represents an “infinite” wing and shows section CL and section CD curves.
Both parts of the study used a wind speed of 31.38 m/s, equivalent to 61 knots (typical takeoff/landing speed of the Cessna 172), and a Reynolds number of approximately 3e6.
Flap-less airfoil results
The results of the study on the flap-less airfoil closely matched expected results predicted by the thin airfoil theory (for airfoils with a thickness of 12% of the cord or less) and experimental data.
It is also worth noting the location of the minimum drag. This minimum drag value occurs at a slight negative α that still yields a small amount of upward lift. This is also as expected and, along with the other results, validates the system and the setup.
SOLIDWORKS Flow Simulation works perfectly with Microsoft Excel, and I was able to export and plot the results seamlessly for plotting. The plot below shows the lift and drag characteristics of the airfoil as α is changed.
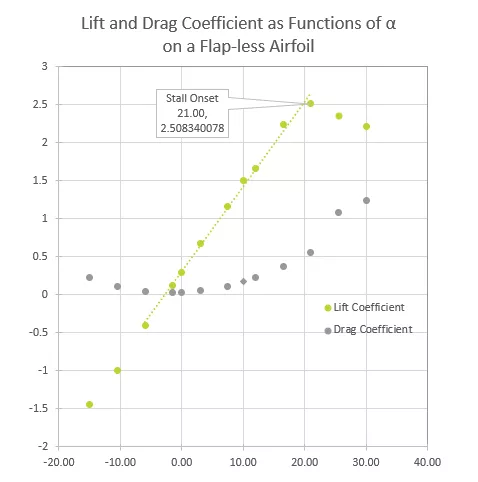
I must note that the trendline of the linear portion of the CL Curve has a slope that closely matches the expected value as predicted by the thin airfoil theory (when α is measured in radians rather than degrees, this slope is nearly 2π).
While the slope of the linear portion is as expected, the stall onset begins at an α of 21°. Figures 2 and 3 show images of the airfoild with flow attached at 10° and detached (stall) at 30°. This angle is higher than the 15°-20° that empirical and analytical data predict.
The error here is not overly surprising as predicting adverse pressure gradient behavior is notoriously difficult.
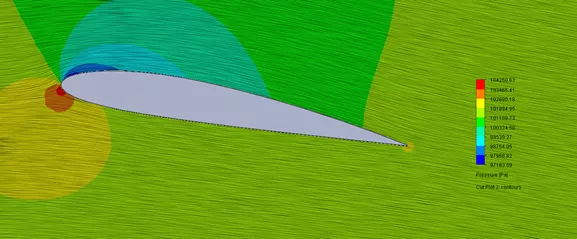
Figure 2. Pressure contour map of NACA 2412 airfoil at an angle of attack of 10° with superimposed streamlines
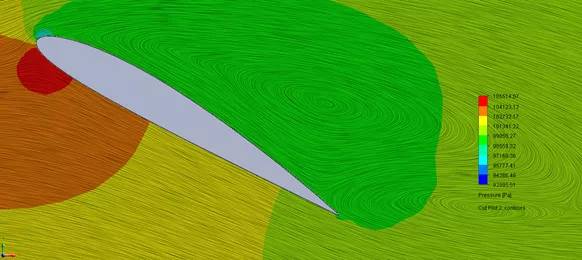
Figure 3. Pressure contour map of NACA 2412 airfoil at an angle of attack of 30° with superimposed streamlines. Notice the large wake behind the wing indicating stall and loss of lift. 30° is well past the expected stall α
Flap airfoil results
The images in the GIF above are steady-state images showing the pressure field with streamlines superimposed. They show a fully developed flow at each deflection angle, and no transient behavior is displayed.
Many parameters go into the design of a slotted flap, of which I considered only a small number here. I fixed the design and performed a 1D parametric study to find CL and CD as functions of α. The data collected is shown below.
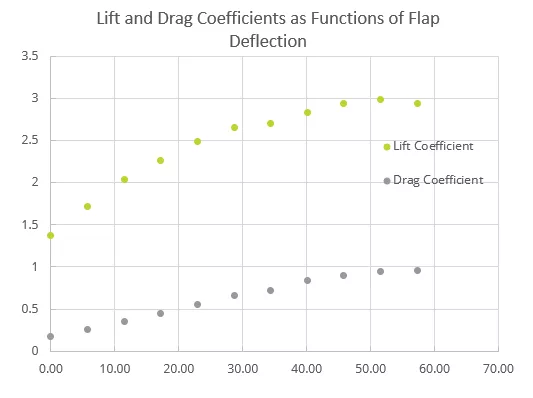
A more robust study would help us find the best CL and CD curves as I varied parameters like flap cord fraction, slot and flap geometry, hinge location, and others. SOLIDWORKS Flow Simulation can run such a study, saving time and money by jumping ahead in the prototyping process.
Figure 4 shows the comparison state between the flap-less airfoil and the airfoil with flaps, with the results of the two studies being within 2% of each other.
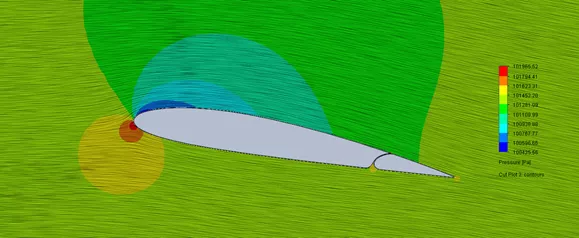
Figure 4. Pressure contour map of NACA 2412 airfoil with flap deflection of 0°, angle of attack of 10°, and superimposed streamlines. This figure closely matches Figure 1, as do the measured force results
The deflection of the flaps causes changes in the flow around the airfoil. The pressure fields and superimposed streamlines at individual design states show some of the airflow details in the following figures. These images can help the designer decide which parameters to focus on when moving forward with the design.
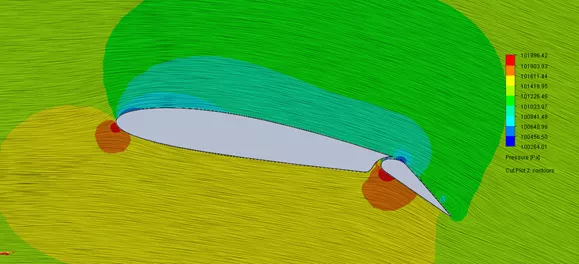
Figure 5. Pressure contour map of NACA 2412 airfoil with flap deflection of 30°, angle of attack of 10°, and superimposed streamlines. Notice the small eddy at the trailing edge of the flap. 30° is the typical maximum flap deflection of a Cessna 172
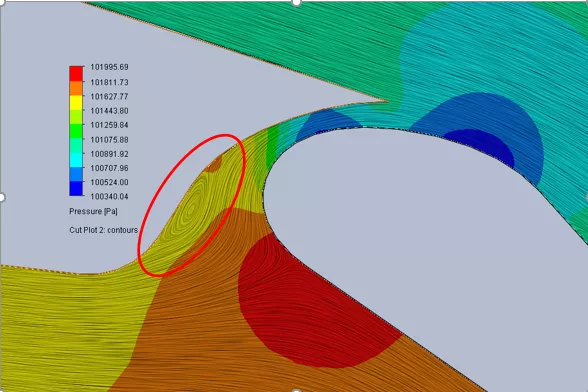
Figure 6. A close-up view of the slotted flap at 10° of deflection. The bright red and dark blue portions show how the slotted flap generates more lift. Notice the small eddy (circled in red) that formed behind the main part of the wing. This suggests that the geometric design could be further refined to maintain an attached flow in the slot throughout the range of expected flap deflection values
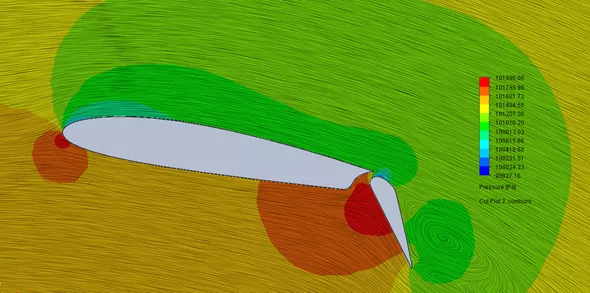
Figure 7. Pressure contour map of a NACA 2412 airfoil with flap deflection of 60° and superimposed streamlines. Wake formation is visible behind the flap and corresponds to a reduction in lift and increase in drag
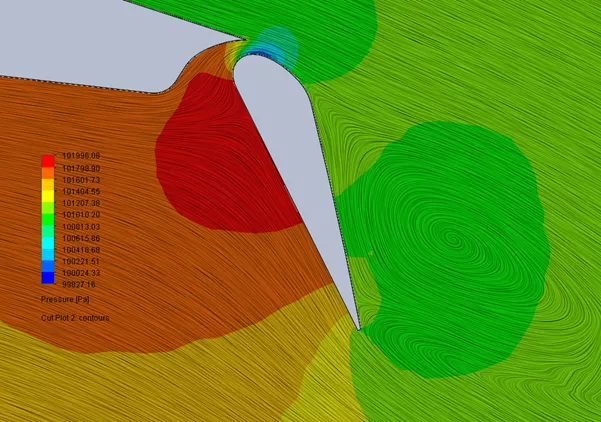
Figure 8. A close-up view of the slotted flap at 60° of deflection. Here, the lift value has begun to decrease, and further deflection of the flap will only reduce the value of CL while CD continues to increase
Summary
Using SOLIDWORKS Flow Simulation, I was able to study the lift and drag behavior of a NACA 2412 airfoil with and without flaps. I was also able to automate the design exploitation process using a parametric study.
A more robust study simultaneously comparing multiple parameters is to follow and will continue to show how SOLIDWORKS Flow Simulation is a powerful tool in the design process.
More SOLIDWORKS Flow Simulation Studies
Backspin is Important to Your Basketball Free Throw! A SOLIDWORKS Simulation Study
SOLIDWORKS Flow Simulation Transient Pressure Pulse Study
SOLIDWORKS Flow Simulation Fluid Mixing Tutorial
Understanding the Tesla Valve Using SOLIDWORKS Flow Simulation

About Andrew Smith
Andrew Smith is an Application Engineer and Simulation Specialist at GoEngineer. Andrew earned his bachelor’s degree in mechanical and aerospace engineering and his master’s degree in mechanical engineering at Utah State University, where he wrote his thesis on baseball aerodynamics and discovered the Seam-Shifted-Wake. He is passionate about engineering, fluid dynamics, and simulation and loves helping others find the best engineering solution for their problem. When not working, Andrew can be found reading crag-side or mountain biking with his family.
Get our wide array of technical resources delivered right to your inbox.
Unsubscribe at any time.