SOLIDWORKS Simulation Plot Legend Options
This article explains the options available for modifying the appearance of SOLIDWORKS Simulation Plot Legends. Legends are the color charts that appear when showing result plots. When viewing the chart, these options allow users to customize the look and have better flexibility to store these settings any time a new study is created.
Formatting Font & Text Size
The default position for the SOLIDWORKS Simulation plot legend is on the right-hand side when viewing the results. In this example, the default appearance uses the default color scheme along with the values displayed in scientific notation.
While this information looks good, the text format is a bit too small to read. To update this, go to Simulation > Options > System Options. Here you can use the plot subtitle and color chart buttons to change the font style and size. By placing these in the default simulation options, this will carry over to all subsequent studies viewed in SOLIDWORKS.
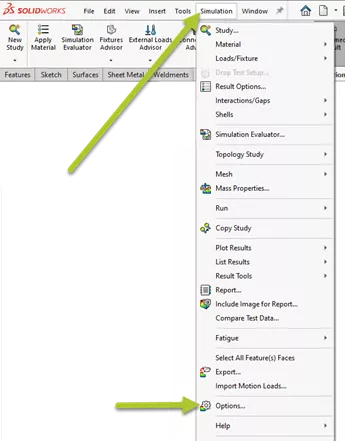
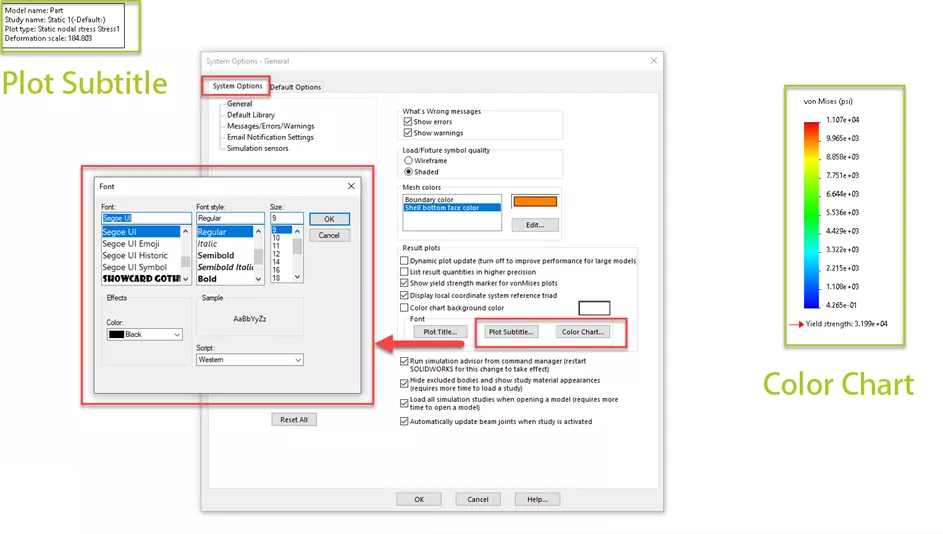
Chart Position & Display Settings
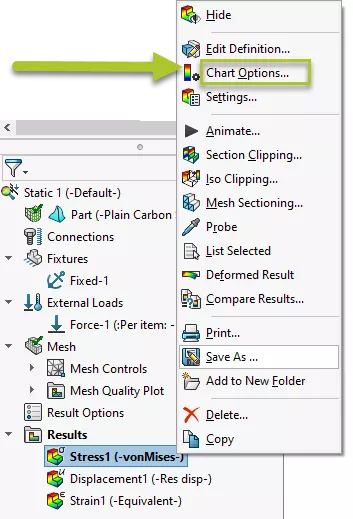
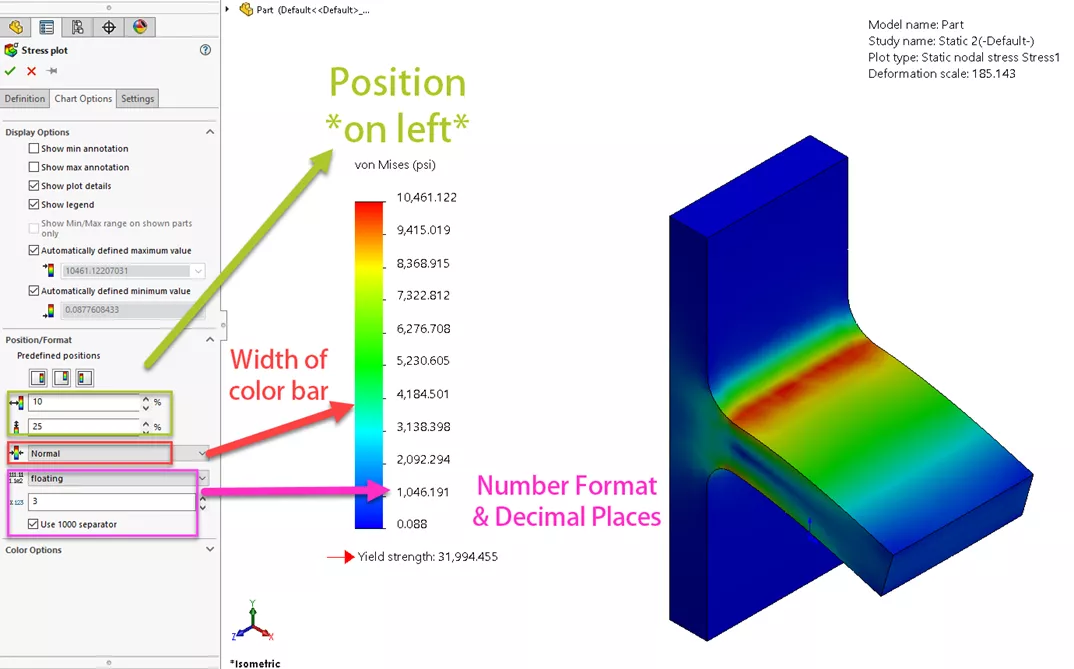
On our Study Tree, we can right-click the plot and go to Chart Options to find more settings for altering its appearance. Under the Position/Format section, we can define the position of the chart, the thickness of the color line, the number format, and the decimal places. If we change the settings here, the options will only affect the current study we’re viewing.
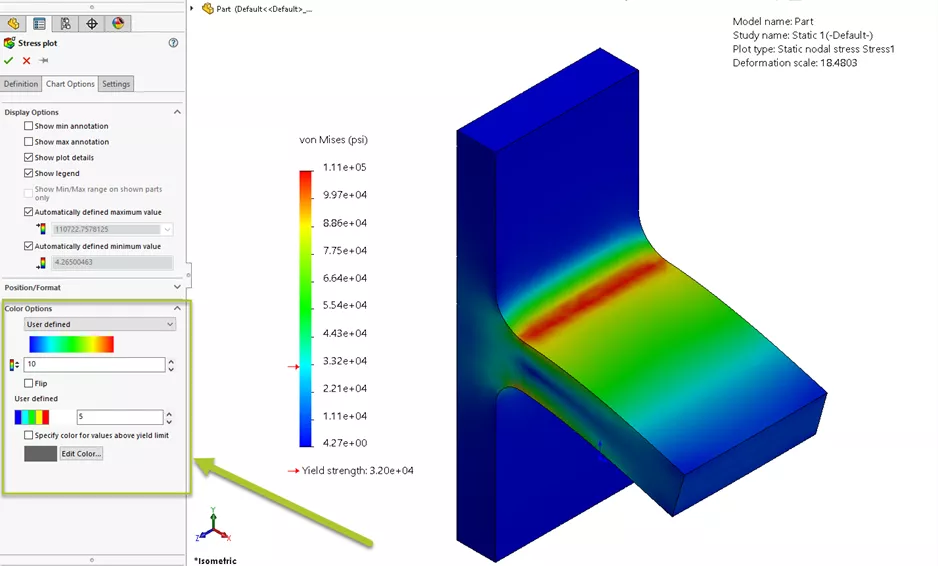
Color Options
In the same section, under Color Options, we can modify the color scheme using several presets. This includes the option to flip the order and a user-defined section to add and change the number of colors being used. Another enhancement of this is the ability to check the option Specify color for values above yield, which allows another chart color to filter areas in the model that match this description.
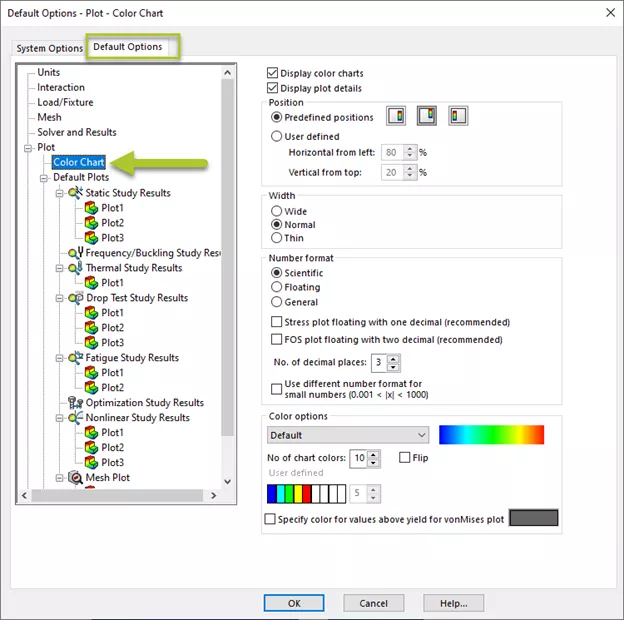
Default Options
The color options we previously discussed can also be set up under Simulation > Options > Default Options > Color Chart. Two additional checkboxes will also allow our charts to display all or none of the details before creating a new study. By adjusting the settings here, any new Simulation study created will carry these color options over.
![]() Want to learn more? Check out our YouTube video for a demonstration of these tips, tricks, and best practices.
Want to learn more? Check out our YouTube video for a demonstration of these tips, tricks, and best practices.
More SOLIDWORKS Simulation Tutorials
SOLIDWORKS Simulation Analysis Productivity Tips
SOLIDWORKS Simulation Buckling Analysis Overview
Rainflow Counting in SOLIDWORKS Simulation Explained
Bolt Shearing Stress in SOLIDWORKS Simulation

About Jackie Yip
Jackie Yip is a Technical Support Engineer at GoEngineer. When Jackie isn’t assisting customers or teaching a SOLIDWORKS Essentials class, he enjoys road biking and keeping up on the latest tech trends.
Get our wide array of technical resources delivered right to your inbox.
Unsubscribe at any time.