SOLIDWORKS Simulation Variable Amplitude Time History Fatigue Tool Tutorial
What is Variable Amplitude Fatigue, and How Does it Work?
Fatigue studies simulate the life and damage of a part or assembly due to repeated loading. SOLIDWORKS Simulation has a powerful tool called Variable Amplitude Time History Fatigue that simulates the damage due to loads of, you guessed it, variable amplitude. These studies can help to understand the expected lifetime of a design using realistic variable loads.
Before using this tool, understand that you need experimental load data for it to work. The Variable Amplitude Time History Fatigue study in SOLIDWORKS Simulation uses Rainflow Counting. Rainflow counting is the industry standard for simplifying the load data, so we don’t have to run a full nonlinear dynamic simulation on an entire test data set.
Rainflow counting replaces the variable load data with a series of constant amplitude fatigue analyses. Rainflow Counting in SOLIDWORKS Simulation performs four functions to streamline the data.
- Hysteresis filtering. This removes any load cycles the user deems too small to matter as a percentage of the maximum range.
- Extracts the peaks and troughs and eliminates the intermediate data
- Manipulates the data to work within the system better
- Counting the cycles using 4-point counting
For more details about Rainflow Counting, read Rainflow Counting: What it is and How it works.
Overview of Variable Amplitude Time History Fatigue
The primary benefit of the Variable Amplitude Time History Fatigue is its capability to simulate realistic variable loads that the design will likely experience. In this example, I wanted to simulate the fatigue of an airplane spar (the main beam in an airplane wing) during flight and determined this would be a great tool. I contacted a friend of mine who does research on experimental aircraft. He kindly gave me specifications on a small, fixed-wing drone and some acceleration data. For our consideration, the drone has a weight of 22 pounds and a wingspan of 3 feet.
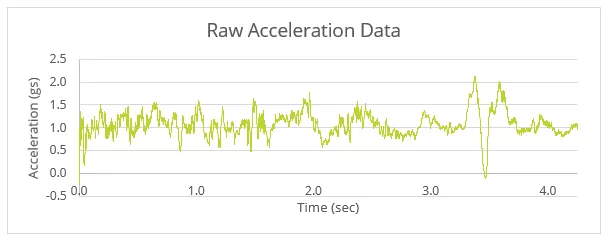
The data is in gs (32.2 ft/s2), so we can quickly work out the load data using Newton’s Second Law.
Setup: Beam Shape
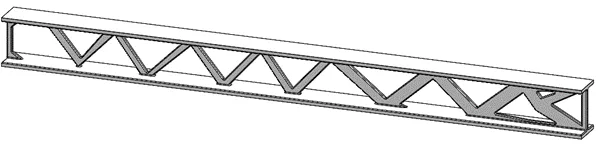
I first needed to model the spar before I could simulate its fatigue. I used a Topology Study to optimize a simple I-beam for a 22-pound fixed-wing drone. I won’t go into the nitty-gritty here, but if you want to learn more about Topology studies, watch this video: Topology Optimization.
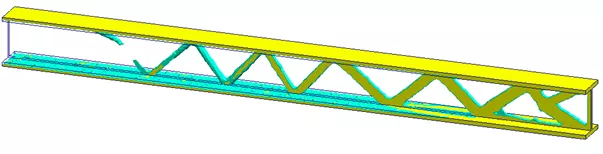
I re-modeled the original beam to roughly match the topology plot by removing unnecessary material and adding fillets to reduce the stress concentrations. The re-modeled beam is shown below.
Setup: Loading Event
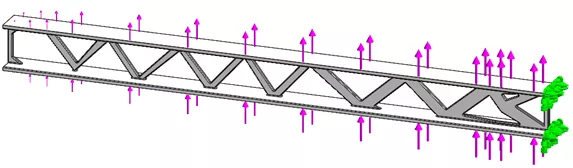
When running a Variable Amplitude Fatigue study, the user needs to specify a “loading event.” This event should be based on an existing study. For this static study, I applied a total load with an elliptical distribution of 22 pounds to the top and bottom faces of the beam. (This is not a perfect assumption but is sufficient for our requirements.)
After running the static study, I created a new Variable Amplitude Fatigue Study.
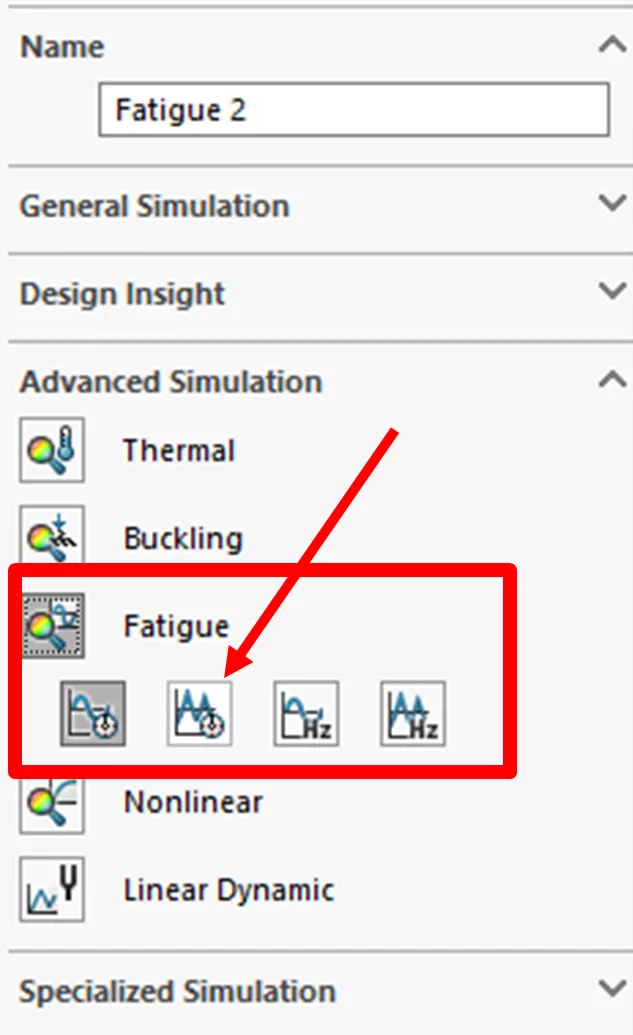
Once the study is open, the setup has three steps one needs to follow to get results:
- Create Loading Event
- Create an S-N curve for the material
- Run study and view results
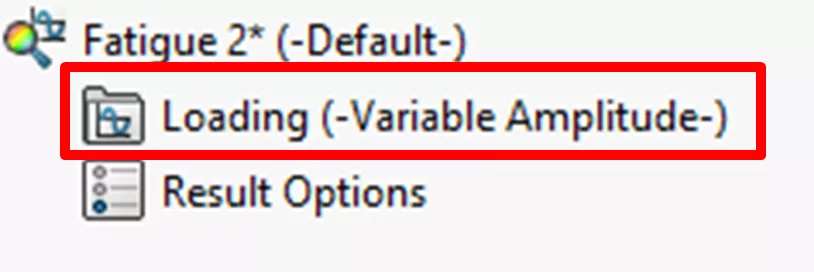
Creating a Loading Event
To create a Loading Event, right-click Loading and select Add Event….
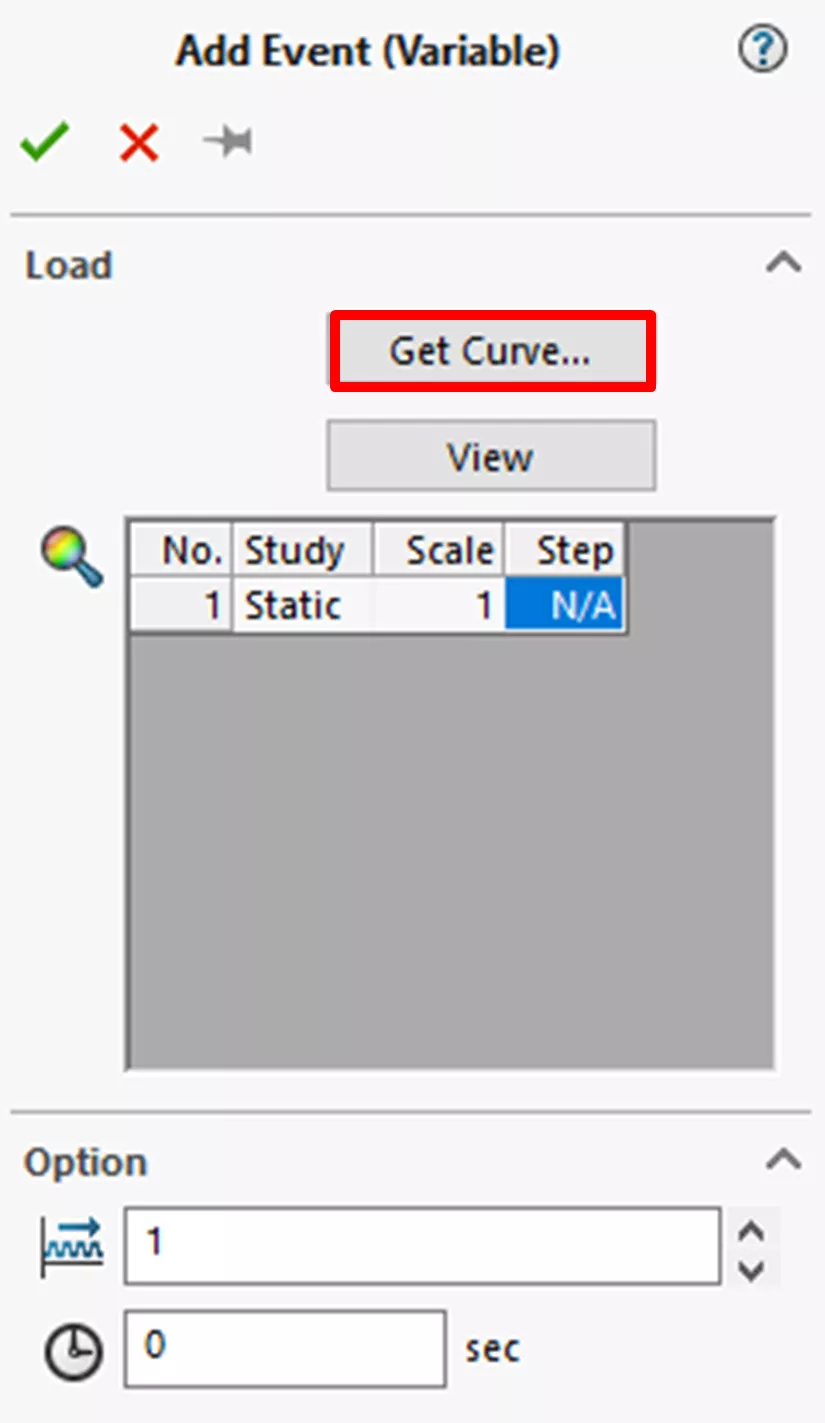
Here, we need to do three things:
- Get Curve…
- Apply a reference study
- Choose Options
Click the Get Curve… button to create a load history curve.
Then enter the correct options into the new dialogue box. In this case, I renamed the curve to Accel in Z in gs, left the Shape as User defined, and changed the Type to Time & Amplitude as I have both the time and the amplitude data. I then copy the acceleration data from excel into the curve data area.
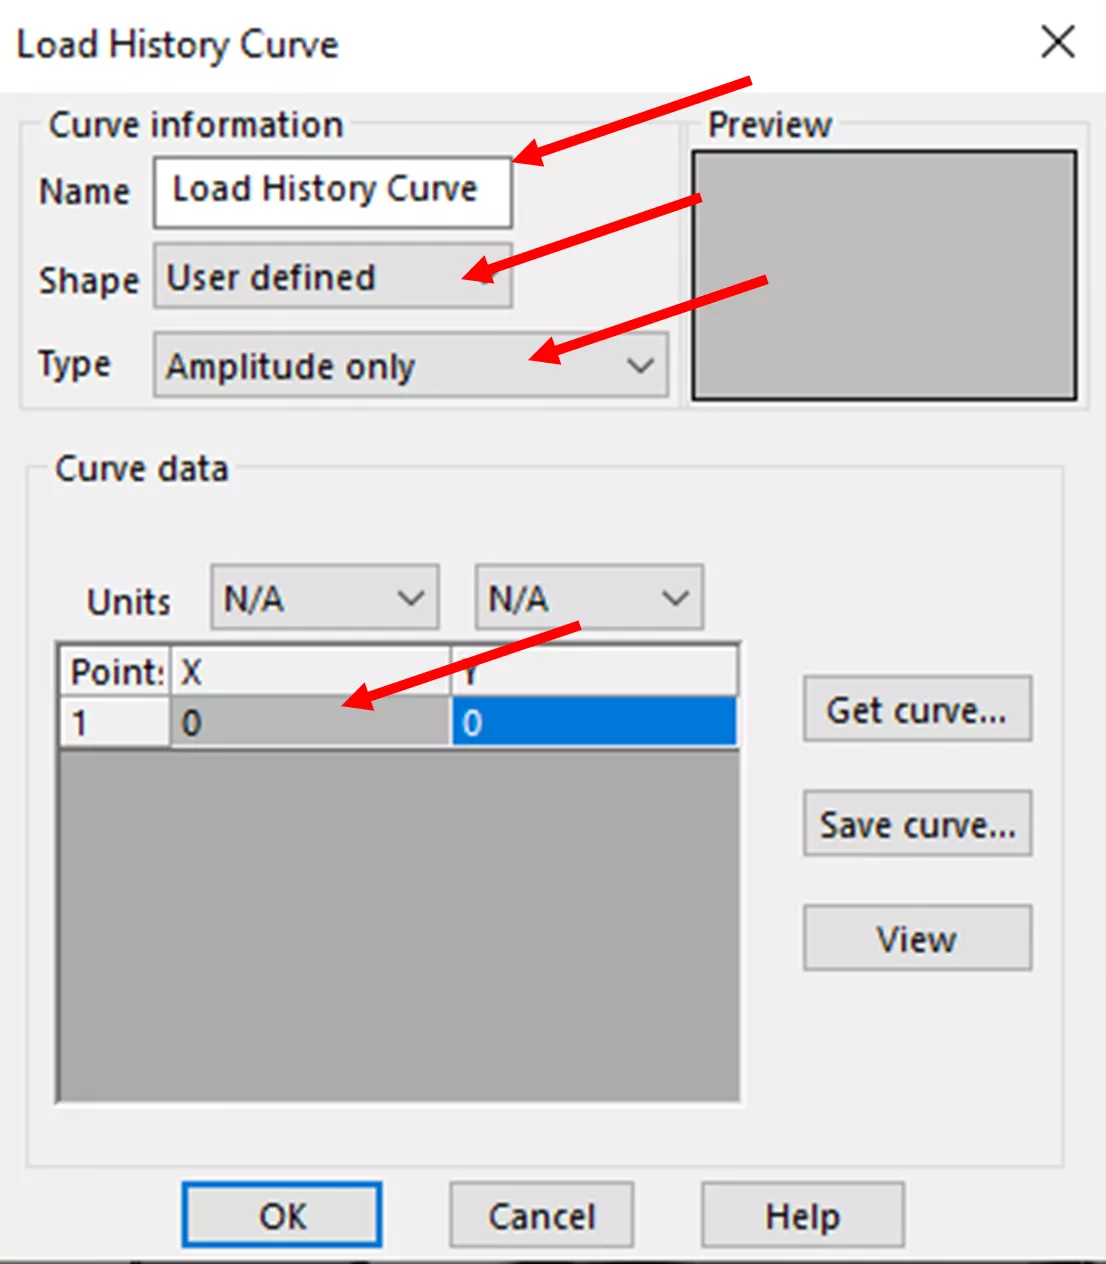
My input looks like this:
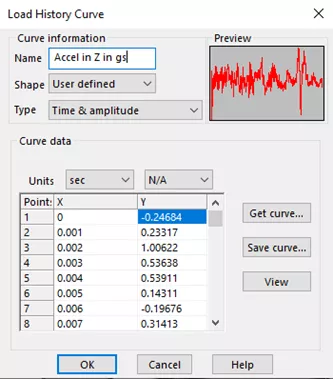
You’ll notice that the units are “sec” for “X” and “N/A” for “Y.” The value in the “Y” column is the normalized load on the wing (i.e., whatever number is in the load data, the simulated load will be that of the static study multiplied by that value). Click OK to move on to the next step.
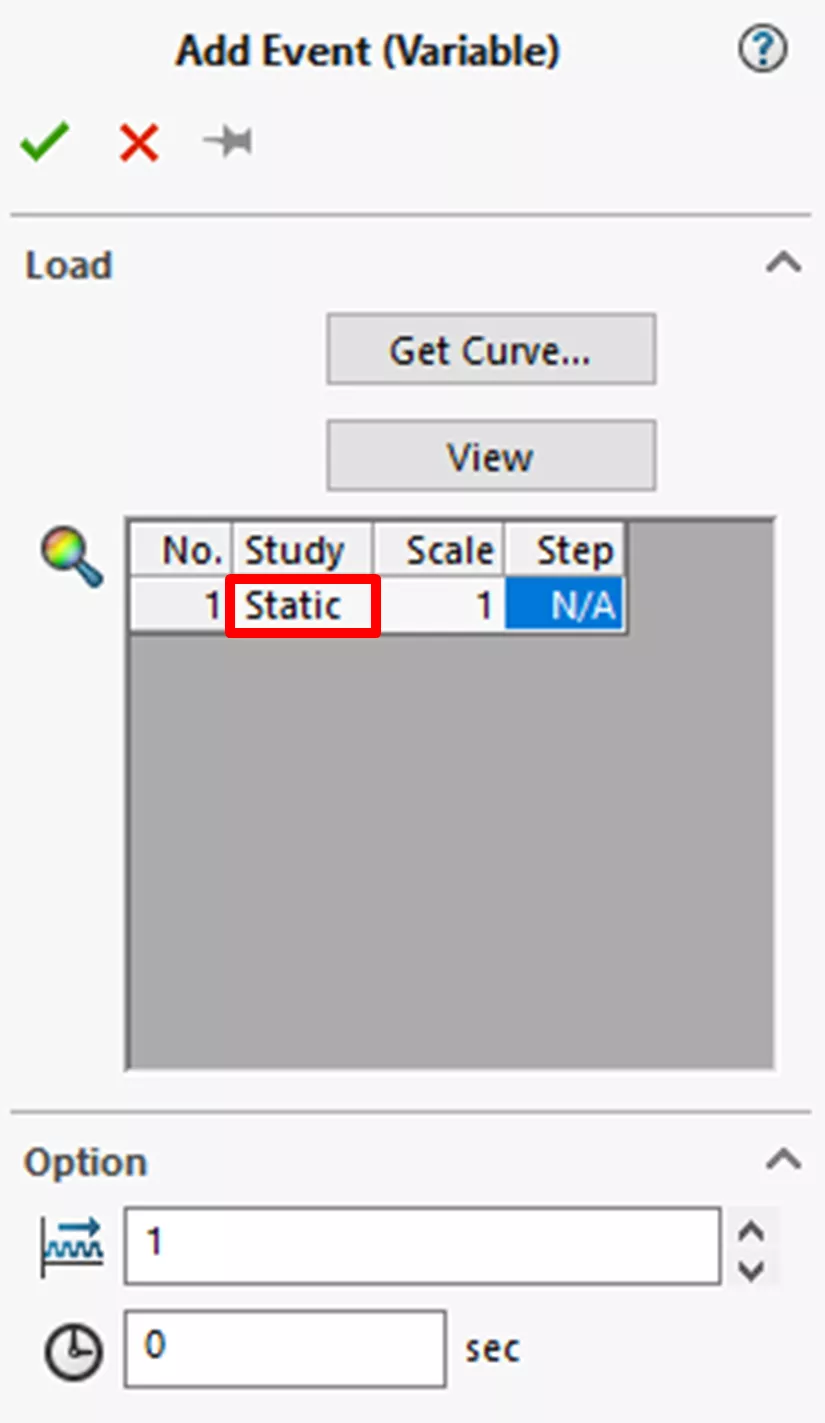
SOLIDWORKS Simulation defaults the selection of the study to the most recent static study. To change the study, simply click in the space on the name of the study, and a pull-down menu shows you the available options. Choose the one that matches your simulation needs best.
The last step for adding an event is selecting options. The first option is Number of Repeats. This option allows you to test the simulation test (i.e., the load history) however many times you want. For example, if you had a 1-hour test and wanted to know the fatigue after 1000 hours, you would enter “1000” into this option. We call this 1000-hour set 1 block.
The next option is start times. When using multiple events, this option allows you to cut off the front end of the load curves up to the time specified.
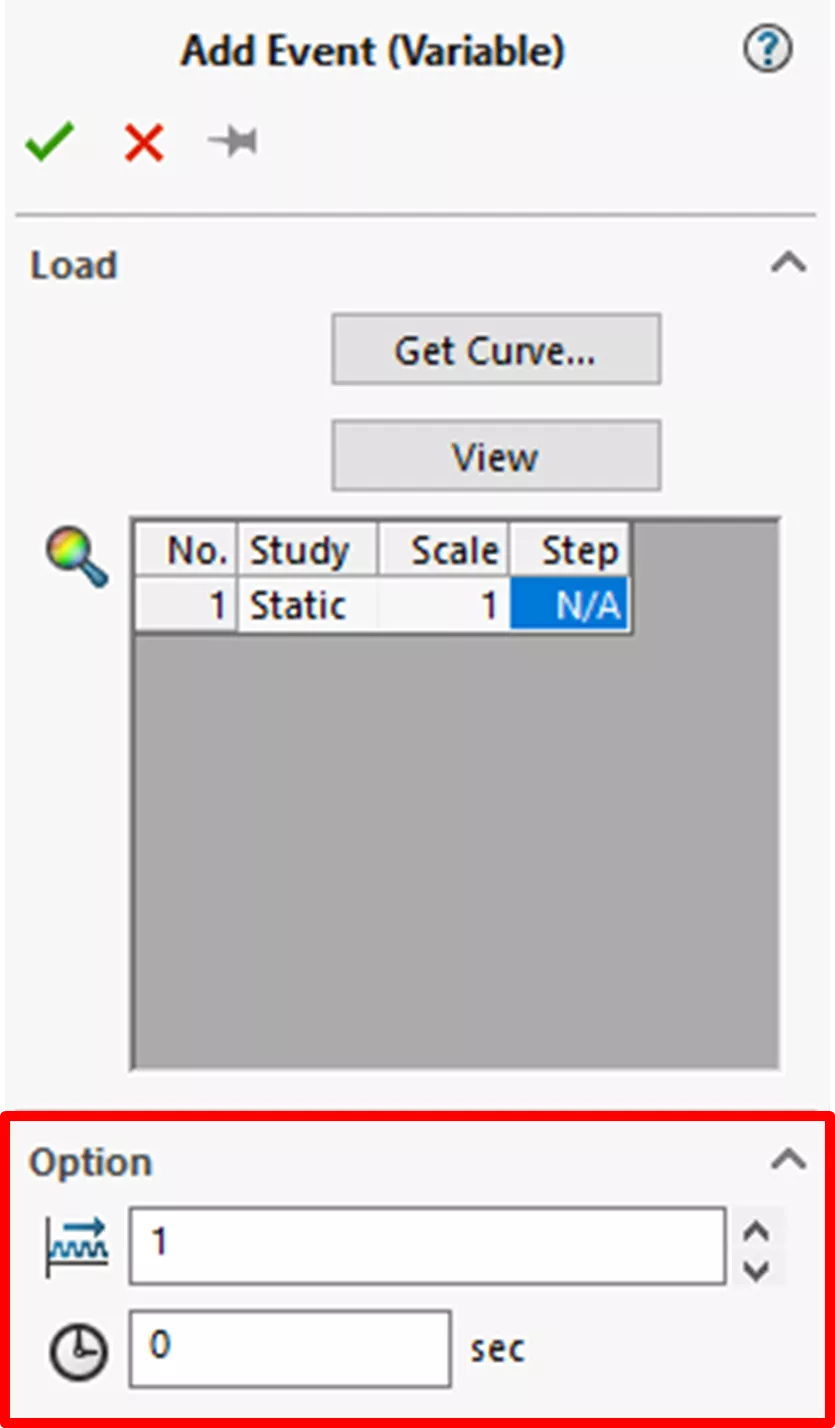
Once all desired options are entered, click the green checkmark.
Creating an S-N curve
The S-N curve can be created in several ways and is essential to any fatigue analysis in SOLIDWORKS.
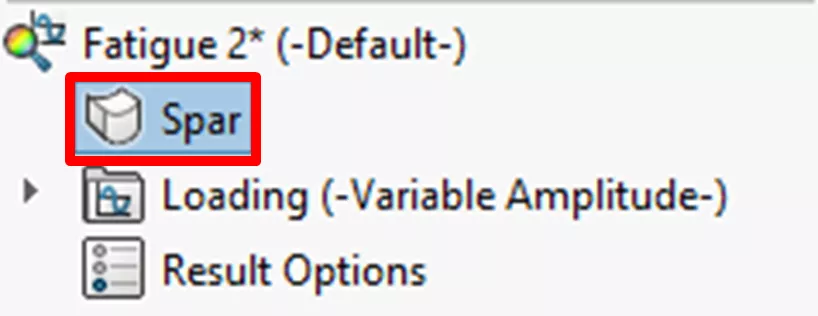
First, we’ll need to right-click the new object (in my case, it is called Spar) in the Simulation Design Tree, which has appeared since we created the loading event. Then select Apply/Edit Fatigue Data.
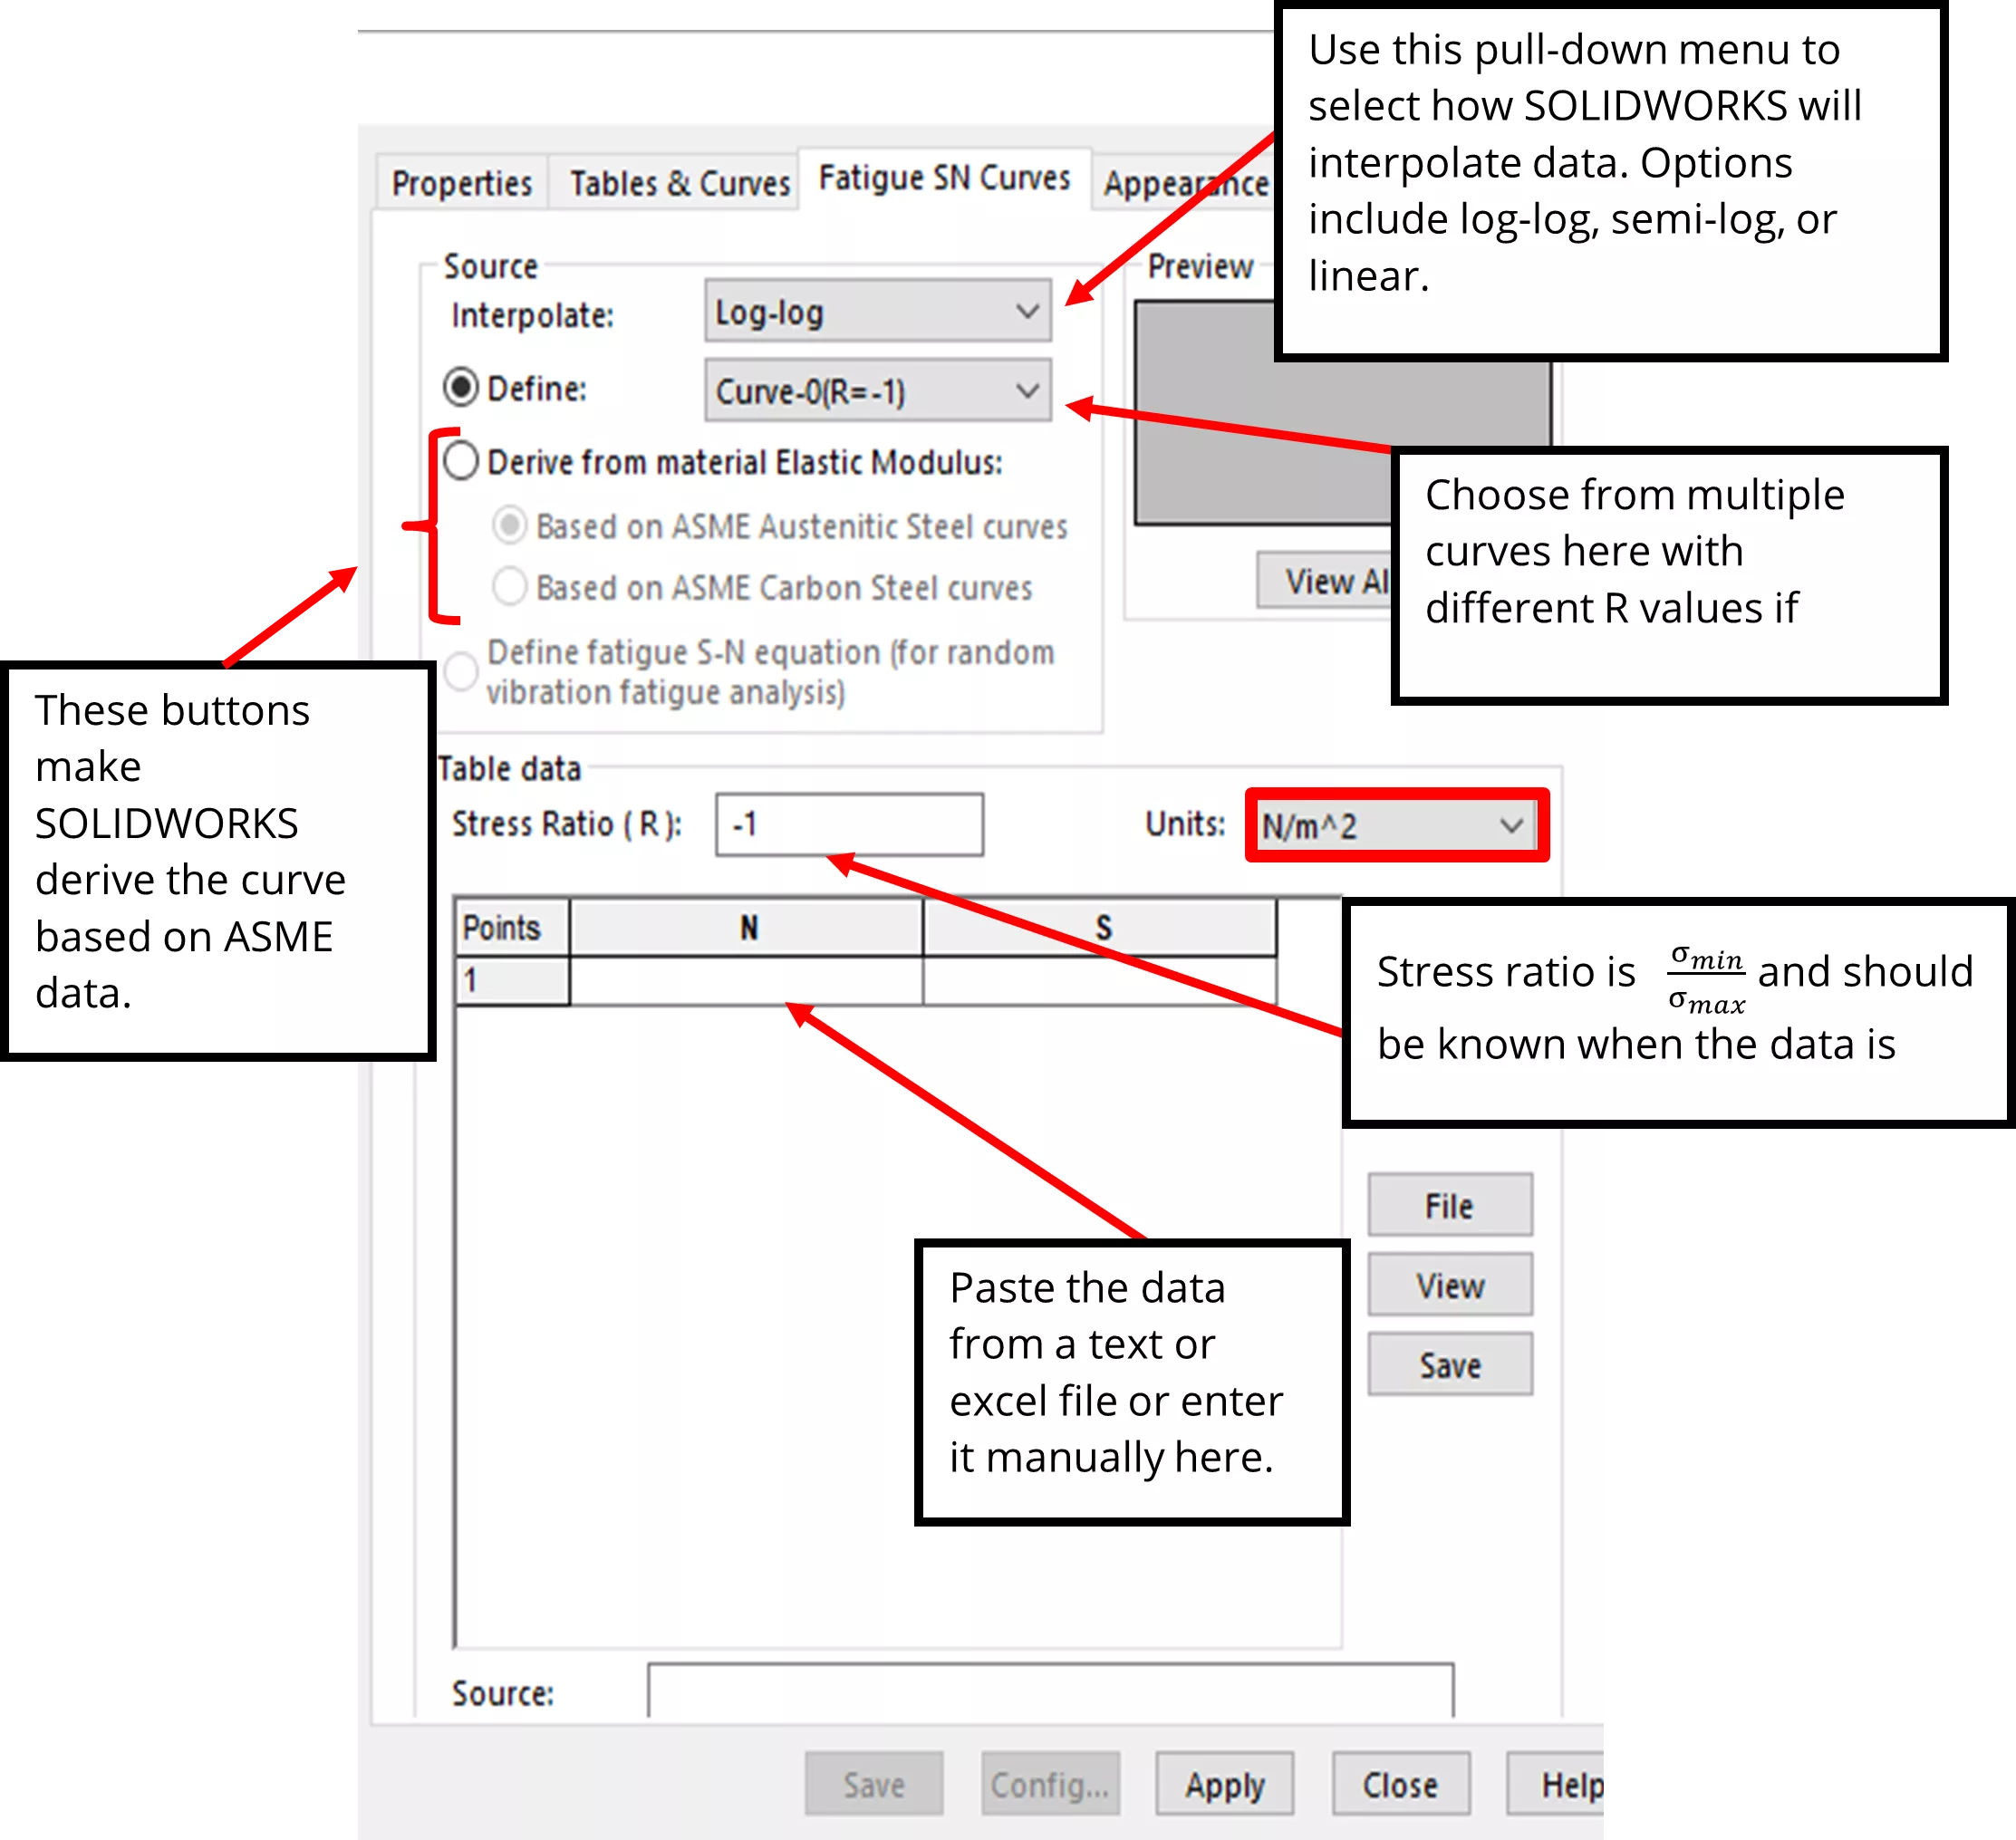
Consult the image below to see the options for adding the S-N curves to your simulation. The user should ensure that the units selected match the data source.
Below, I have entered my data (obtained from a questionable source online) using the copy and paste method.
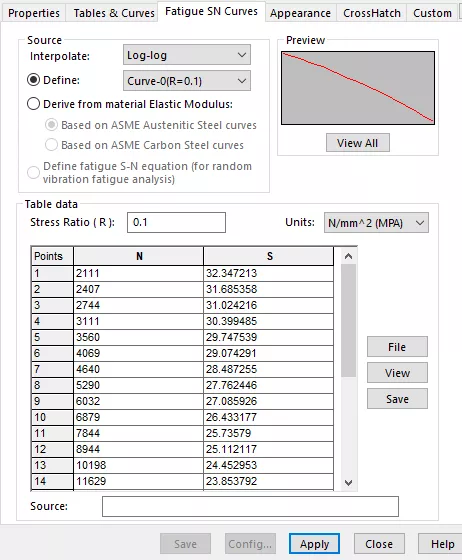
Now hit Apply, then Close.
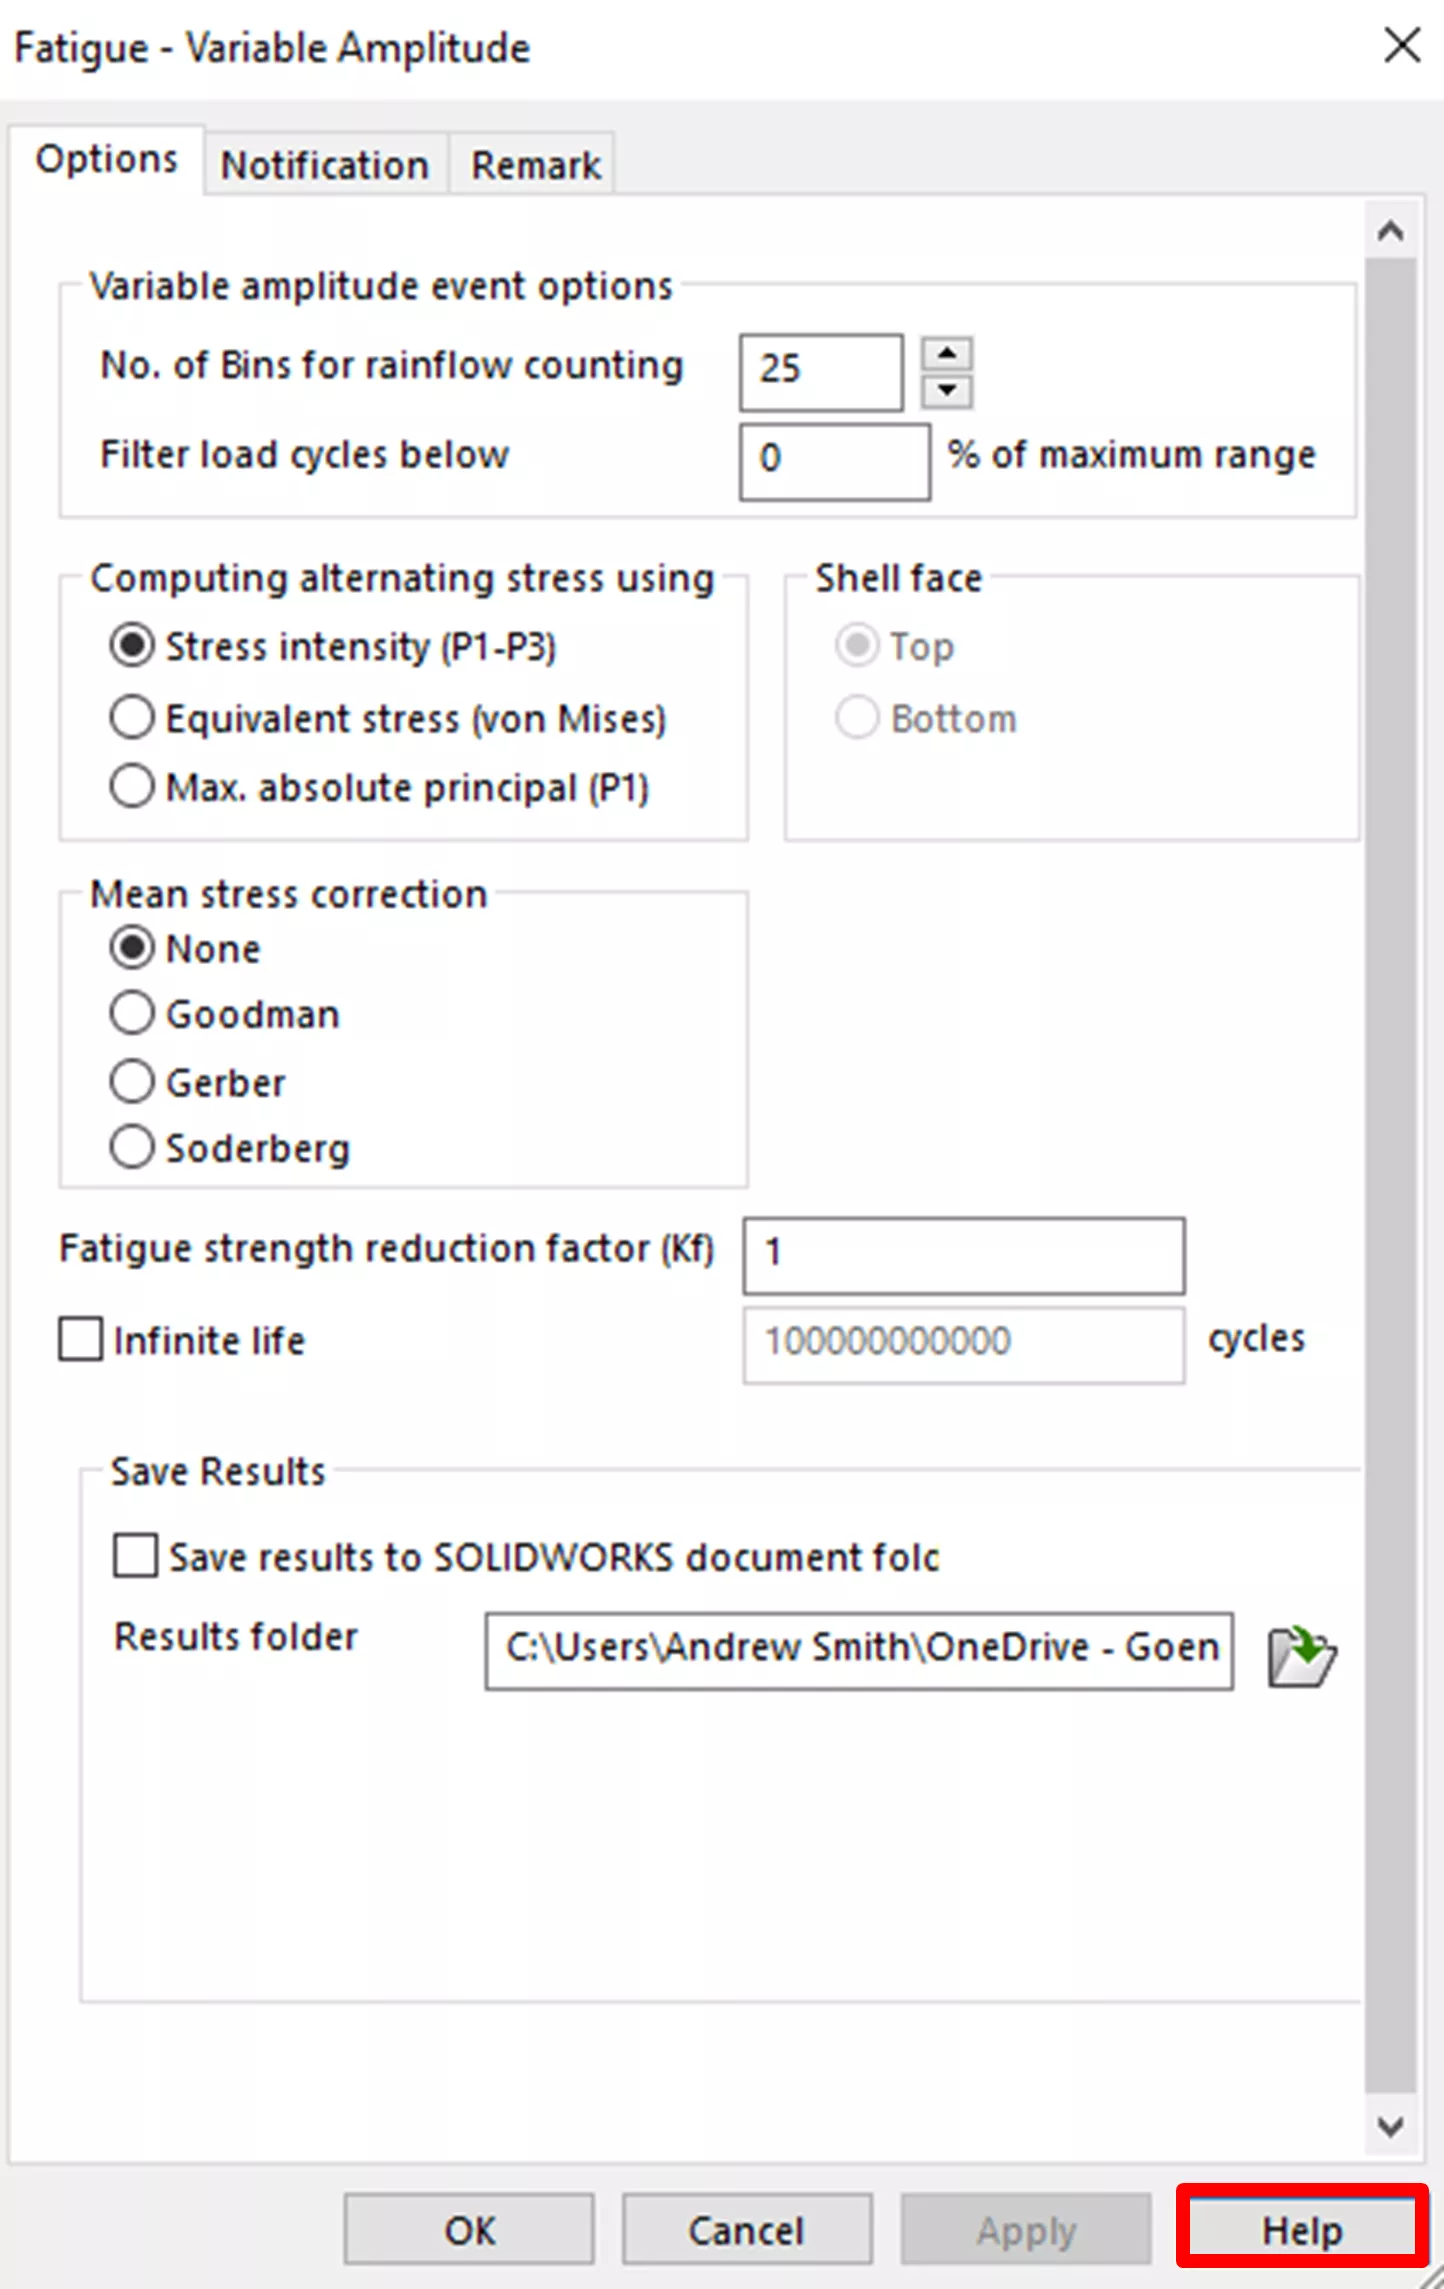
After applying the S-N curve and before running the study, it is essential to ensure that the study properties are correctly set up. Right-click the study name and then click Properties. Of particular importance is the Mean stress correction. For additional information on each of these settings, click the Help button.
Run
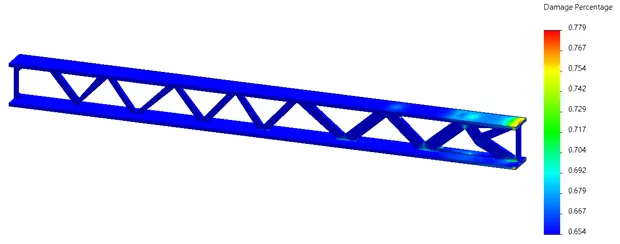
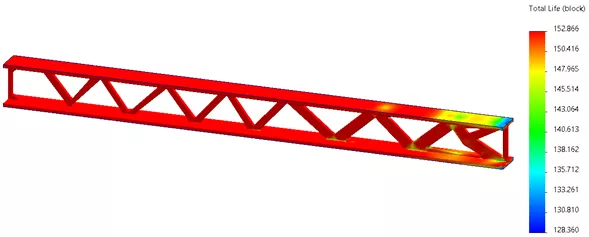
Now, run the study. Two result plots are shown: Damage and Life.
- The Damage plot gives the damage percentage at that location.
- The Life plot shows the life expectancy in blocks (one block is the test data input for the load curve repeated however many times you selected in the options).
Plots shown below:
Conclusion
Variable Amplitude Time History Fatigue studies take a bit more setup than other studies and require some additional experimental Time History Load Data to work. That being said, the benefit of realistic loads can help immensely in understanding fatigue behavior. SOLIDWORKS Simulation allows the designer to understand the design’s expected life, cut back on prototyping, and focus on making designs with appropriate expected lifetimes. The Variable Amplitude Time History Fatigue study is a powerful tool that can save time and money on designs that are expected to go through repeated and variable loading.
Want to learn more?
Check out more SOLIDWORKS Simulation tips, tricks, and best practices below.
More SOLIDWORKS Simulation Tutorials
SOLIDWORKS Simulation Plot Legend Options
SOLIDWORKS Simulation Analysis Productivity Tips
SOLIDWORKS Simulation Buckling Analysis Overview
Fastest Way to Cool a Hot Dog: SOLIDWORKS Flow Simulation Study

About Andrew Smith
Andrew Smith is an Application Engineer and Simulation Specialist at GoEngineer. Andrew earned his bachelor’s degree in mechanical and aerospace engineering and his master’s degree in mechanical engineering at Utah State University, where he wrote his thesis on baseball aerodynamics and discovered the Seam-Shifted-Wake. He is passionate about engineering, fluid dynamics, and simulation and loves helping others find the best engineering solution for their problem. When not working, Andrew can be found reading crag-side or mountain biking with his family.
Get our wide array of technical resources delivered right to your inbox.
Unsubscribe at any time.