SOLIDWORKS Flow Simulation: How Many CPU Cores Do You Need?
Customers often ask what they should purchase in a workstation for SOLIDWORKS Flow Simulation to solve their computational fluid dynamics (CFD) problems as fast as possible. Unfortunately, this question is often followed by an unattainable expectation, such as “Everything needs to solve in less than ten minutes.”
Note: While it may be possible to capture a super speedy solve time, the accuracy of the results will suffer.
The total solve time for a SOLIDWORKS Flow Simulation project is influenced by several factors, such as total cell count, project parameters, heat transfer effects, and convergence goals, to name a few. Let’s focus on what is possible by comparing total solve time for three different CFD projects on a variety of workstations.
The Benchmark Files
The SOLIDWORKS CAD data used for benchmark testing are three SOLIDWORKS Flow Simulation Tutorial files: A2 Conjugate Heat Transfer, B4 Mesh Optimization, and C5 Rotating Impeller.
The Tutorials PDF can be found in the <SOLIDWORKS Installation folder>\SOLIDWORKS Flow Simulation\lang\english\Docs folder.
Similarly, the benchmark files can be found in <SOLIDWORKS Installation folder>\SOLIDWORKS Flow Simulation\Examples.
Be sure to copy the example files to a directory outside of C:\Program Files to have read/write access. We also recommend opening the files from the Ready folder unless you want to work through the full tutorial.
The mesh settings for each Tutorial model were adjusted to create larger problems for our comparisons. For tutorial A2 Conjugate Heat Transfer, the global mesh setting was increased to Level 4. The total number of cells after this modification is 241,630. (Figure 1)
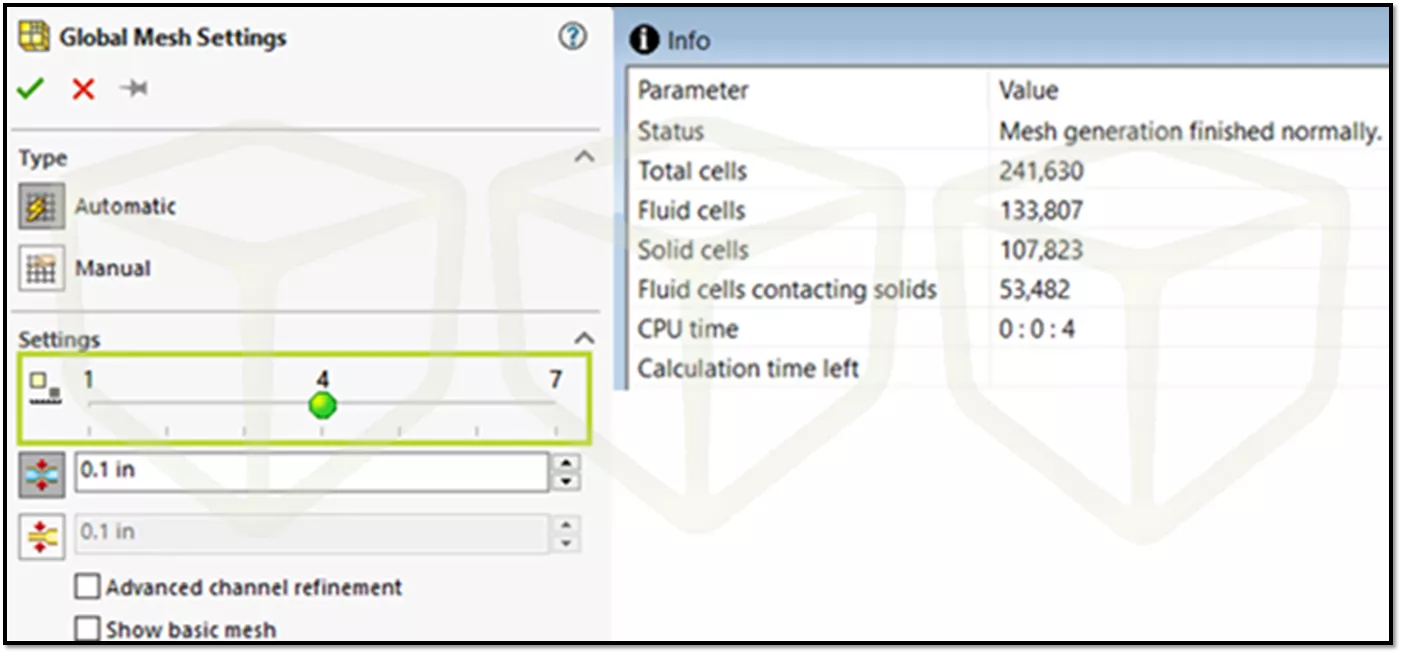
Figure 1: Benchmark A2 mesh modifications, final mesh size
For tutorial B4 Mesh Optimization, the benchmark begins in the section Creating a Second Local Mesh. The changes made to the Global Mesh Settings include manually specifying the number of cells in cartesian space and adjusting the number of refining cells for the second mesh control. The total number of cells after these modifications is 501,667. (Figure 2)
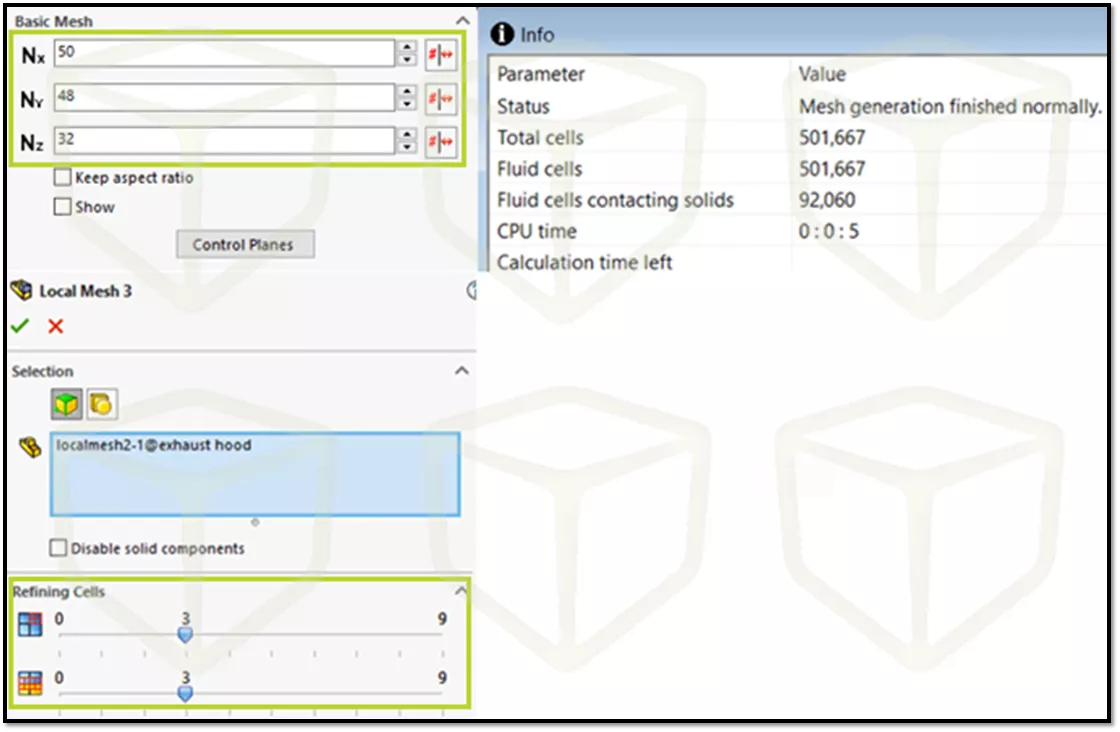
Figure 2: Benchmark B4 mesh modifications, final mesh size
For tutorial C5 Rotating Impeller, the global mesh setting was increased to Level 5. The total number of cells after this modification is 190,800. (Figure 3)
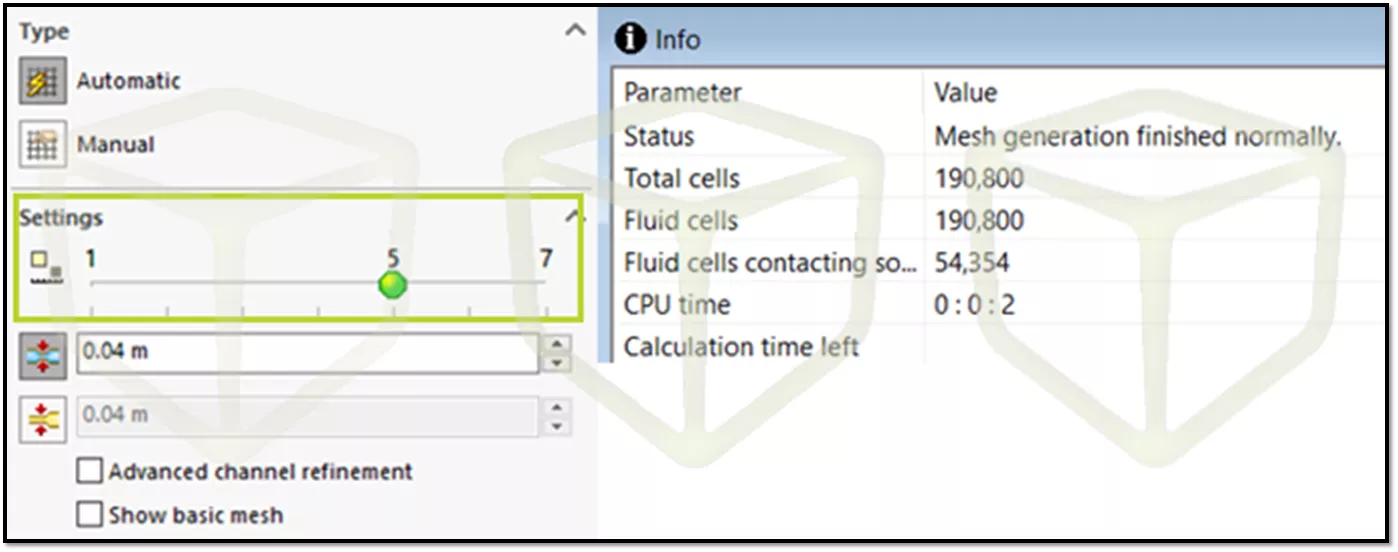
Figure 3: Benchmark C5 mesh modifications, final mesh size
The Benchmark Workstations
In this study, we utilized five different workstations for evaluating SOLIDWORKS Flow Simulation performance. The CPUs range from 7th generation to 11th generation Intel and AMD Ryzen Threadripper Pro 5000 series processors. In general terms, these are workstations you could have purchased six years ago to something you can purchase today. The workstation models and key component specifications are in Figure 4.
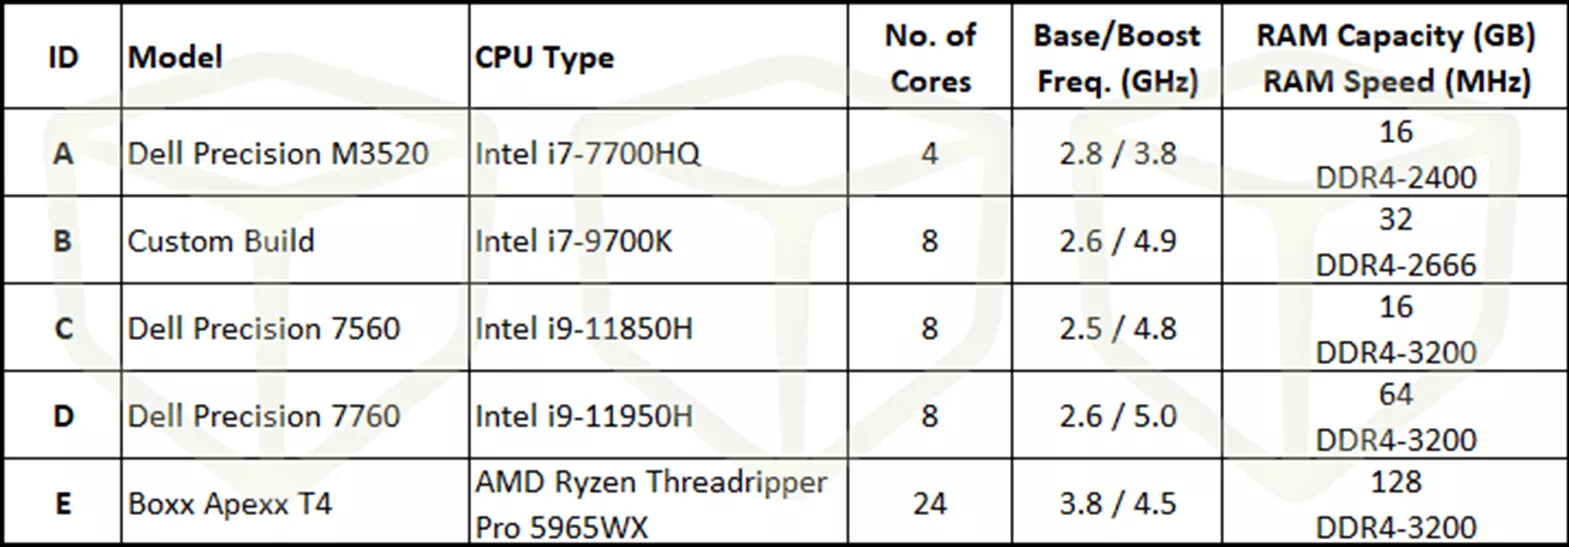
Figure 4: Workstation specifications used for benchmark testing
- Workstation A was commonly purchased for our training lab facilities several years ago. These were not equipped with the top-end processors available at the time, however, they were more than adequate for their intended purpose.
- Workstation B is a rebuild from several years ago. When we rebuilt this workstation, the Intel 9th generation i7-9700K was one of the higher-end options available.
- Workstation C is representative of machines currently used at several of our training facilities.
- Workstation D is the workstation we currently use as well as several of our GoEngineer Simulation Team colleagues for our daily work.
- Workstation E is a recent addition that our Simulation team utilizes for CAE Consulting Services when a high-end workstation is needed.
Additional Information About SOLIDWORKS Flow Simulation Benchmark Testing
Prior to solving these benchmark models, we would often refer customers to SOLIDWORKS Knowledge Base article S-034487 “Usage of multiple CPUs and influence on solution time”. This article, and the included FAQID document, are what we have referenced for several years to guide customers toward better-informed decisions for improving SOLIDWORKS Flow Simulation performance. The new version of this article can be found in the Dassault Systèmes Support Knowledge Base, QA Article QA00000109363. (Login required for access.)
Our testing followed the procedure outlined in this updated Knowledge Base article. Also, we would have liked to include 12th and 13th generation Intel processors in our benchmark, however, we did not have workstations with these processors available when we conducted our benchmark testing.
We utilized SOLIDWORKS 2022 SP 5.0 for all tests. When looking at the results data later in this article, Total CPU Time is the average of each SOLIDWORKS Flow Simulation project being solved three times with the specified number of cores used for a CFD project. Total CPU Time data is gathered from the .STDOUT file of each solved project, as described in QA00000109363. Finally, all projects were solved using SOLIDWORKS Flow Simulation Batch Run, set up as shown in Figure 5, with the Maximum simultaneous runs at this computer set to 1.
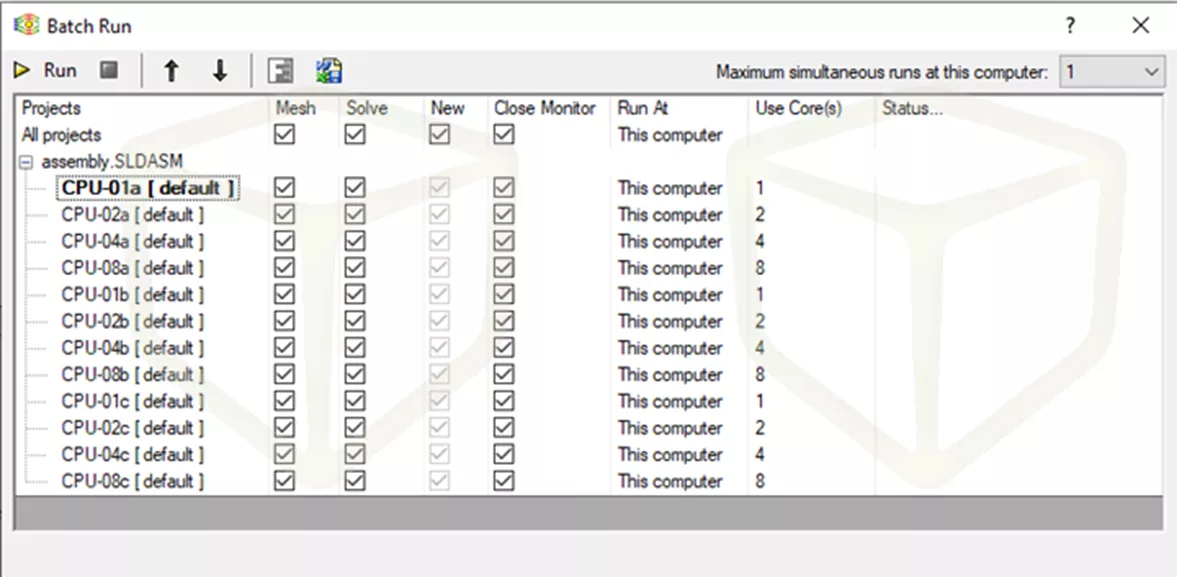
Figure 5: Example of Batch Run setup used for benchmark testing
The Results Are In!
Beginning with Benchmark A2 Conjugate Heat Transfer, the data in Figure 6 shows what we would expect. The oldest machine with the least compute power, Workstation A, had the longest solve times. The newer workstations C, D, and E had the shortest solve times. When utilizing fewer processor cores for a solve, both Workstations C and D edged out Workstation E with the higher base clock speed. While this is an interesting data point, I cannot think of a reason you would want to run a SOLIDWORKS Flow Simulation project on a single core – other than for benchmark comparisons!
The difference in solve times for nearly every Benchmark A2 project on each machine, solved with the same number of CPU cores, was less than ten seconds.
The sole exception was Workstation A solution with 2 CPU cores, having a 25 second difference between the minimum and maximum Total CPU Time. The Workstation E solve time with 8 cores was 178 seconds compared to 120 seconds with 24 cores. While the solve time does decrease by 32%, it was accomplished with 3x more CPU cores.
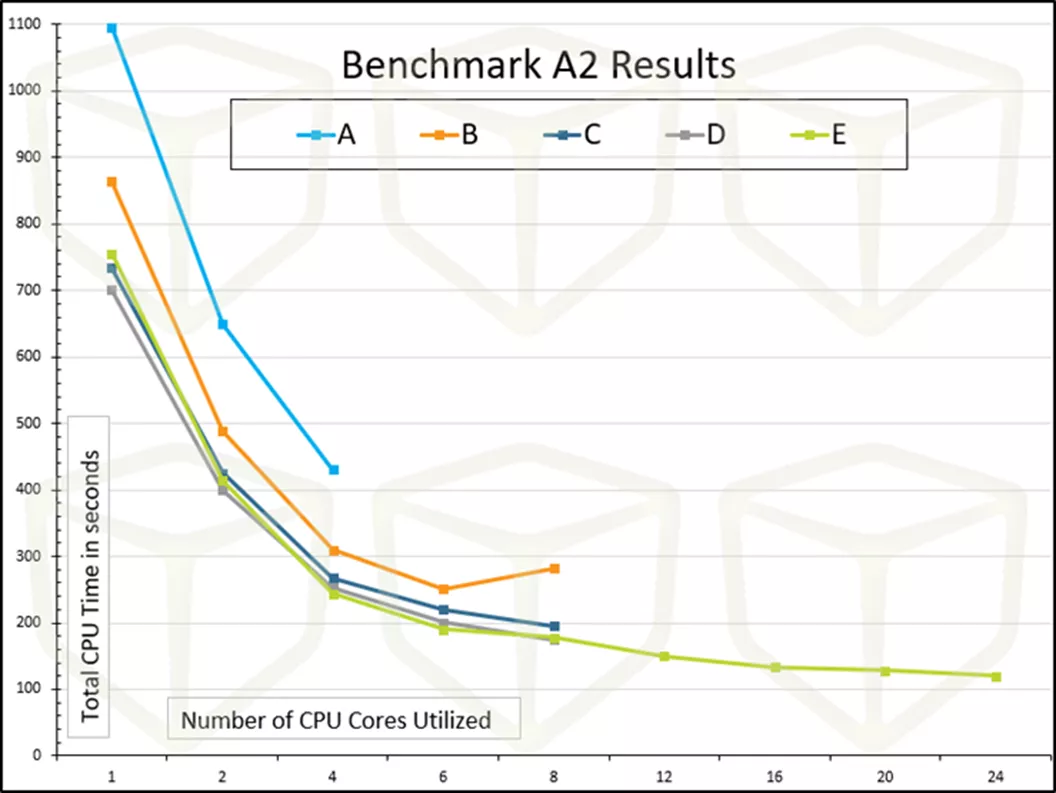
Figure 6: Benchmark A2 results
Next is Benchmark B4 Mesh Optimization. The data in Figure 7 aligns with what was presented for Benchmark A2; newer processors perform better than older processors. Benchmark B4 has the largest total mesh size of the three benchmarks, thus, it is expected to tax the compute resources more heavily.
Regarding differences in solve time, Workstations A and B varied by 282 and 287 seconds, respectively, when solved with 2 CPU cores. Nearly all the other solved projects varied by less than 75 seconds for a like number of processor cores utilized. Workstation D solve time with 8 cores was 1,002 seconds compared to Workstation E with 8 cores at 954 seconds. Workstation E with all cores utilized solved Benchmark B4 in 541 seconds, a 43% improvement compared to the Workstation E 8-core solve.
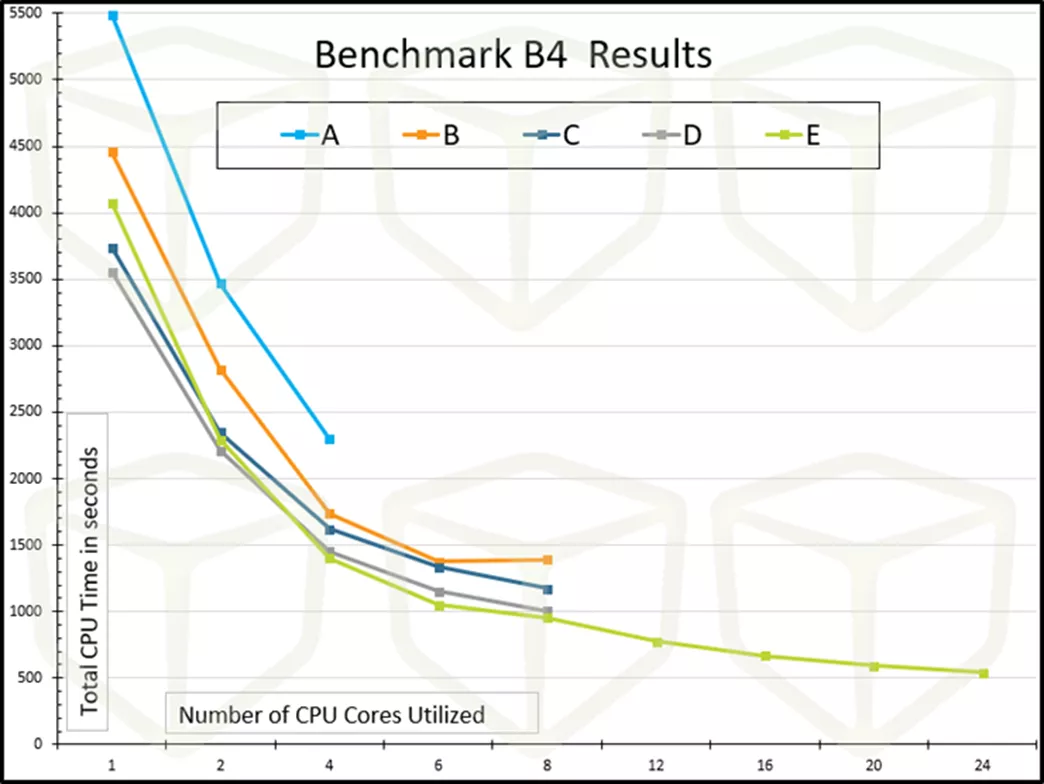
Figure 7: Benchmark B4 results
Finally, Benchmark C5 Rotating Impeller is a global rotating region problem and the smallest mesh of the three benchmarks. Data shown in Figure 8. The Total CPU Time varies from 1,013 seconds (Workstation A, 1 core) on the high end to 98 seconds (Workstation E, 24 cores) on the low end. For all solved iterations, the variance was less than 11 seconds for like projects solved with the same number of processor cores.
The Workstation E 8-core CPU solve time was 158 seconds compared to 98 seconds when all 24 cores were used, a 38% improvement.
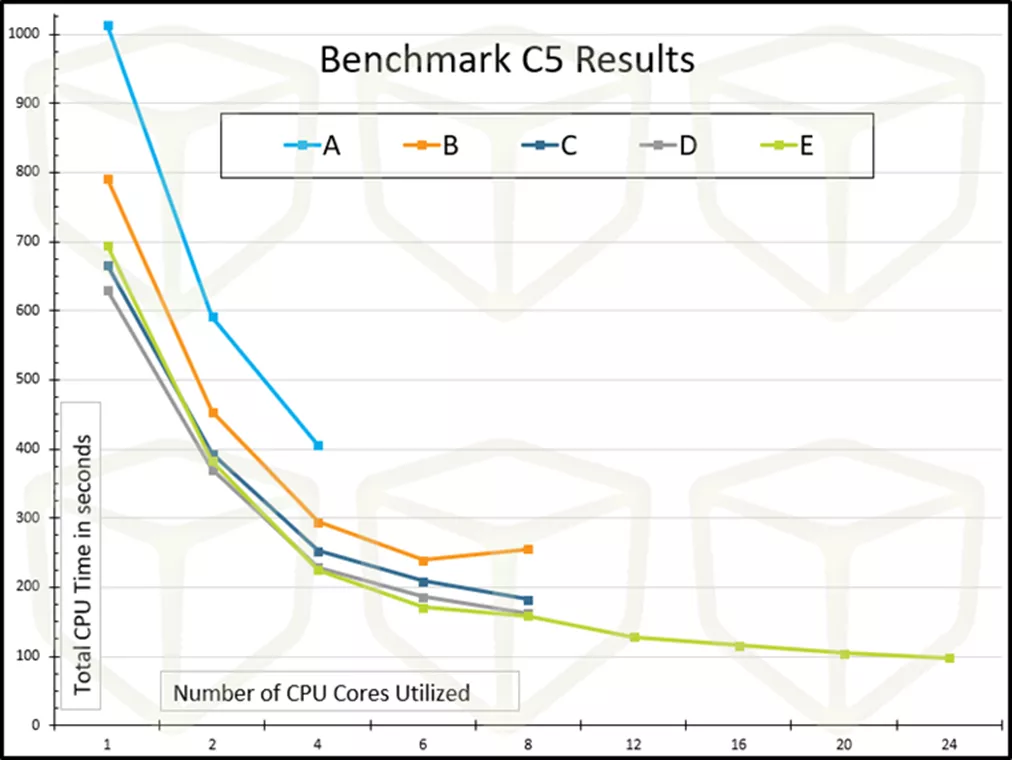
Figure 8: Benchmark C5 results
The data presented follows what I believe most of us already knew – “newer, better, faster, more” is a generally good thing for reducing SOLIDWORKS Flow Simulation solve times. There is one interesting item to point out from the data presented above.
Workstation B was less efficient when solving with 8 cores compared to only utilizing 6 cores. We checked the data for those projects and re-ran the studies for verification. That was unexpected and not something that either of us can definitively explain.
What About Really Big Problems?
We know what you are thinking. ‘None of those benchmarks are really big problems’. We agree that a SOLIDWORKS Flow Simulation project with less than half a million cells may be thought of as “small”, though that total cell count may be more than adequate for many SOLIDWORKS Flow Simulation projects.
This benchmark would not be complete without setting up a really taxing problem for our workstations to crank through. With that in mind, we modified tutorial ‘A2 Conjugate Heat Transfer’ with a global mesh setting at Level 6. A minimum wall thickness was added, set to 0.09 inches. The total number of cells after these two modifications is 3,605,138. (Figure 9)
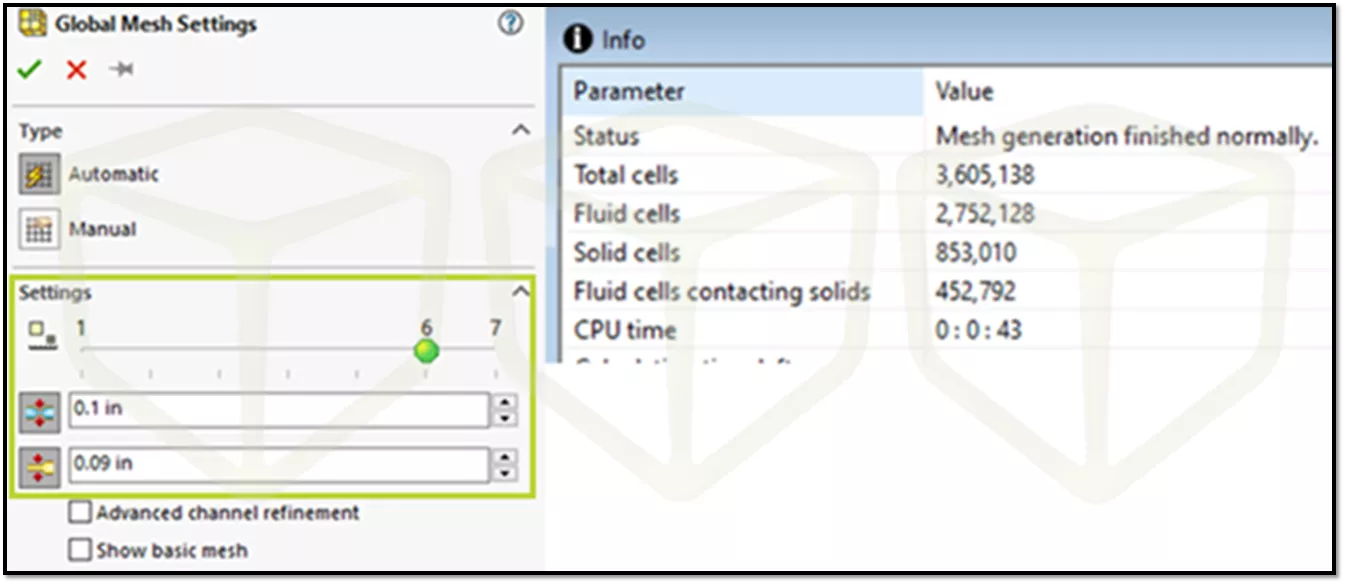
Figure 9: Benchmark A2 'Large' mesh modifications, final meh size
For this “large” benchmark problem, all available cores were used for workstations A, B, C, and D. For Workstation E, the solve was completed with 8, 12, 16, 20, and 24 cores to provide insight into how adding additional CPU cores can reduce SOLIDWORKS Flow Simulation project solve times. The data for these solutions is shown in Figure 10.
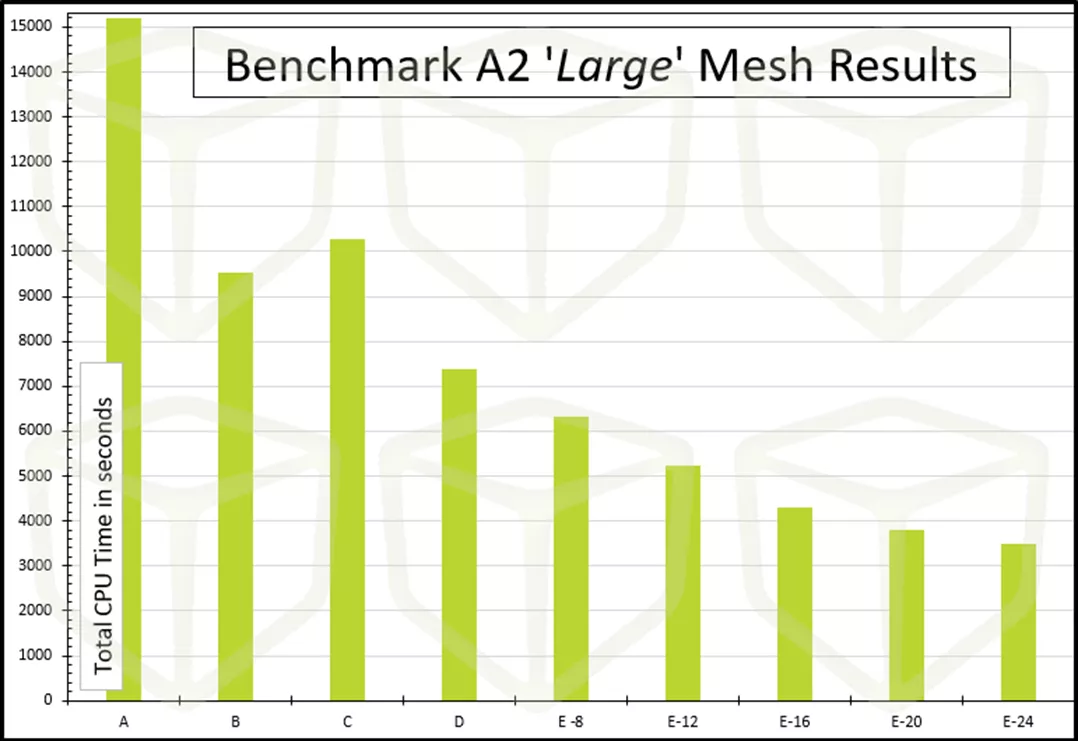
Figure 10: Benchmark A2 'Large' results
As expected, the longest solve was on Workstation A, a whopping 15,197 seconds (253.3 minutes, or 4.22 hours).
On the opposite end of the spectrum is Workstation E all-core solve, coming in at 3,494 seconds (58.2 minutes).
The general trend is more cores will solve a large SOLIDWORKS Flow Simulation project in less time. The lone exception is the Workstation C solve time of 10,281 seconds. This workstation is limited by having only 16GB RAM, as witnessed by watching Windows Task Manager report in use and committed RAM at or near the maximum for much of the solve.
Final Thoughts
There is a lot of data to consume from what have presented here. If you are currently using a several-year-old workstation and your CFD analysis work needs a performance boost, a newer workstation is a reasonable choice. Selecting a high core-count processor is not the only limiting factor for achieving a significant reduction in solve time with SOLIDWORKS Flow Simulation. Addressing all potential bottlenecks in a workstation is the path to achieving the best performance. This means consideration for how much and how fast the RAM is in a workstation. It also means selecting fast solid-state drives to read data from and write data to.
Lastly, multithreading does not provide a linear improvement in solve time reduction. While more available processor cores will reduce total solve time, it should be apparent from the charts that there is a limit to performance gains when adding more CPU cores. From prior discussions we have had with SOLIDWORKS Technical Support, multithreading gains diminish beyond approximately 20 threads. This becomes an important consideration when factoring the price increases between processors with even higher core counts.
So exactly how many CPU cores do you need for better SOLIDWORKS Flow Simulation performance?
From our data, an 8-core processor is the low end of what you should consider. On the high end, a processor with 20 to 24 cores will provide more processing headroom, especially for larger CFD projects.
Be sure to select a processor with both a high base and high boost frequencies to pare with the number of cores.
Now go make your products better with SOLIDWORKS Simulation!
Contributing Authors
Bill Reuss, Sr. Application Engineer Specialist, Simulation & Computer Nerd
Matt Sherak, Sr. Application Engineer Specialist, Simulation, Elite Application Engineer, Simulation Enthusiast
Related Articles
7 Important Tips for New SOLIDWORKS Users
SOLIDWORKS Simulation Mesh Convergence in Frequency Analysis
Calculating the Center of Pressure in SOLIDWORKS Flow Simulation
SOLIDWORKS Flow Simulation Heat Pipes Explained

About Bill Reuss
Bill Reuss is an Elite Application Engineer and Simulation Specialist with GoEngineer working in the Louisville, KY office. Bill earned a Bachelor of Science in Mechanical Engineering degree at The University of Louisville J.B. Speed School of Engineering. His professional experience ranges from medical devices to commercial beverage equipment to consumer products. He began using SOLIDWORKS in 1995 and still has his original User’s Guide. Bill is a self-professed computer nerd, coffee connoisseur, golf junkie, and has a passion for problem solving with all things Simulation!
Get our wide array of technical resources delivered right to your inbox.
Unsubscribe at any time.