7 Steps to Perform a Fatigue Analysis in SOLIDWORKS Simulation
Fatigue is a phenomenon that is observed when repeated loading and unloading weakens an object over time, even when the induced stresses are considerably less than the allowable stress limits. Setting up a fatigue analysis in SOLIDWORKS Simulation will allow us to determine whether a product will be able to withstand usage requirements over a period of time and not just if the product will hold up a single specified load environment.
A successful fatigue analysis can be performed in seven steps:
- Determine the load type during study creation
- Add events
- Define fatigue data
- Result options
- Fatigue study properties
- Run the analysis
- Postprocess the results
In this blog, we’re going to break down each of those steps. Let’s get started.
#1. Determine load type during study creation
In general, there are two types of loading histories available when defining a fatigue study: constant amplitude loading and variable amplitude loading.
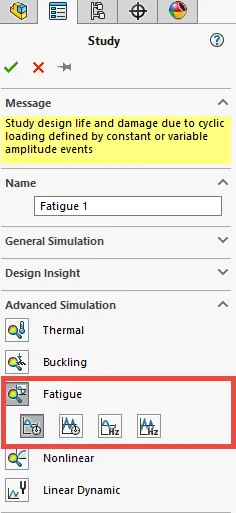
However, when defining a fatigue study, there are four options in the new study dialogue window from which to choose. The choices are:
- Constant amplitude events with defined cycles
- Variable amplitude history data
- Harmonic-fatigue of sinusoidal loading
- Random vibration - fatigue of random vibration
All cycles of a constant amplitude event have the same alternating and mean stresses.
Constant amplitude
A constant amplitude event is fully defined by an alternating stress, mean stress and the number of cycles. A fatigue event can refer to one or more static studies (linear and nonlinear), or to a particular solution step from nonlinear or modal time history dynamic studies. The software calculates the worst alternating stress levels for each event.
Variable amplitude
A variable amplitude event is a load history record that defines the fluctuation history of a load.
Harmonic-fatigue
The Harmonic-fatigue of sinusoidal loading option creates a fatigue study that is based on stress results as a function of frequency from a Linear Dynamic - Harmonic study.
Random vibration
The Random vibration – fatigue of random vibration option creates a fatigue study that is based on stress results as a function of frequency from a Linear Dynamic - Random vibration study.
#2. Adding events
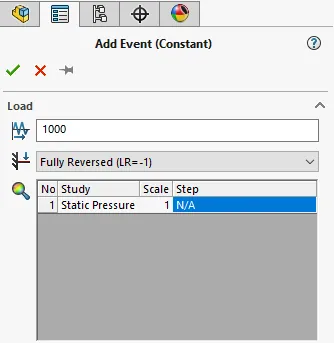
For a constant amplitude event:
- Input the number of cycles for the event (e.g., 1,000,000 cycles).
- Specify the loading type.
- Fully Reversed
a. Zero Based
b. Loading Ratio
c. Find Cycle Peaks - Select the reference study/studies to tie to the event.
A Fully Reversed load would be an application where a load is fully reversed for a set number of cycles (e.g., a 1000 lb force load in the X direction is oscillating between the positive and negative X directions. Essentially, the software changes the value of the load from positive to negative for a single cycle and the analysis is run for a set number of cycles). The loading ratio for a fully reversed load is -1. The loading ratio is defined as the minimum load divided by the maximum load. This event is based on a single reference study.
A Zero-Based load would be one where a load is varied between zero and the value of the load (e.g., from 0 to 1000 lb). Another way of stating this would be to call it an on/off load. The loading ratio for this scenario is 0. This event is based on a single reference study.
The Loading Ratio option allows one to specify a user defined loading ratio (i.e. a scenario where the event is not fully reversed or zero based). If the load cycle oscillates between -5 lb to +100 lbs, then the loading ratio would be -0.05 (-5lb/+100 lb). This event is based on one reference study.
The Find Cycle Peaks event type is based on multiple reference studies. The program uses the stress results of the specified studies to find cycle peaks that give the highest alternating stress for each mesh node. An example of this would be if you are evaluating a scenario where a dead load is present (i.e. non-oscillating).
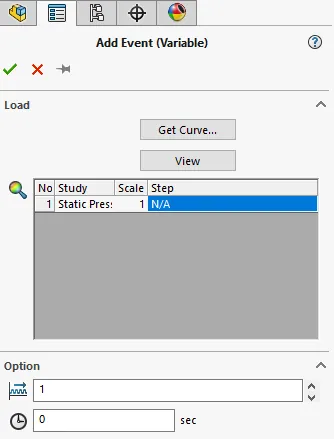
For a variable amplitude event:
- Apply the variable load history curve.
- Specify the reference study to tie to the event.
- Specify the number of repeats for the load history curve and the start times if multiple events need to occur in a specified sequence.
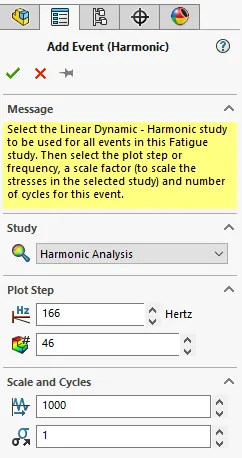
For harmonic-fatigue of sinusoidal loading:
- Select the Linear Dynamic – Harmonic study to be used for all events.
- Select the plot step or frequency.
- Select a scale factor (to scale the stresses in the study) and the number of cycles for this event.
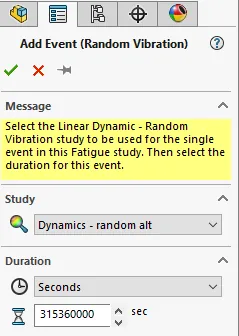
For random vibration – fatigue of random vibration:
- Select the Linear Dynamic – Random Vibration study to be used for the event in this study.
- Select the duration for the event.
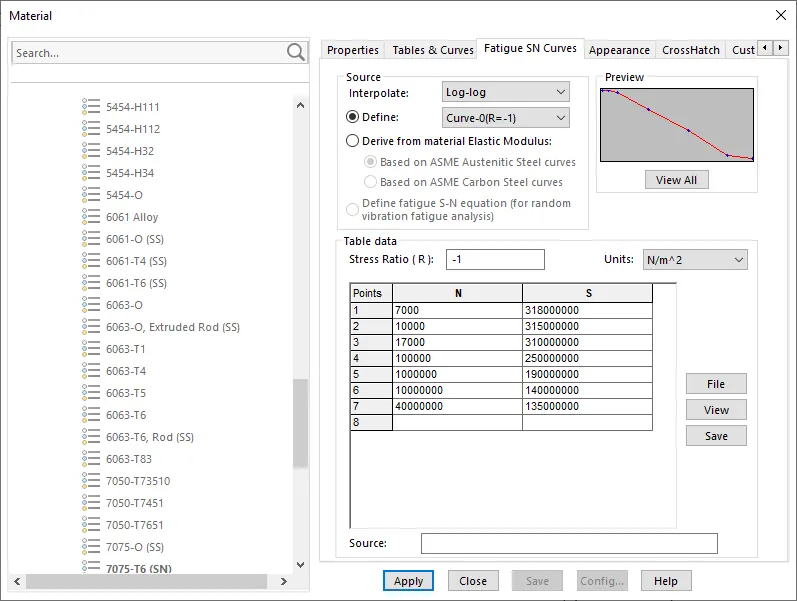
#3. Defining the fatigue data
The software uses a S-N curve to evaluate the fatigue results. A S-N curve defines the alternating stress values versus the number of cycles to failure at a given stress ratio.
When defining the reference studies, one can specify a material that has fatigue data already inputted for the material. In the SOLIDWORKS material database, the materials that have "SN" appended to the name already have a S-N curve defined. For these materials, the S-N curve is based on a fully reversed load (i.e. the stress ratio is -1). If the reference studies do not have S-N data tied to their materials, then one can manually input this data.
It is possible to apply up to ten S-N curves calculated empirically for different stress ratios. This is important when mean stress needs to be calculated correctly. Lastly, if one is using an ASME Austenitic Steel or an ASME Carbon Steel, the software can derive the S-N curve from known ASME S-N data.
Note: The results of a fatigue analysis are highly dependent on the quality of the input S-N curve(s).
#4. Result Options
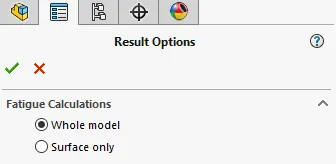
Fatigue calculations can be run for one of two options:
- Whole model (default option)
- Surface only
The Whole model option calculates damage at all locations (nodes) of the model. The Surface only option calculates damage at the boundary nodes only. Using this option assists in saving time since less calculations are needed.
#5. Fatigue study properties
Constant amplitude study options include how to define constant amplitude event interaction, how to compute alternating stress, and how to take into account mean stress (mean stress correction type) when there are not enough defined SN curves to accurately account for mean stress.
Variable amplitude study options include defining the number of bins for rain flow counting as well as the alternating stress and mean stress options.
Harmonic-Fatigue of Sinusoidal Loading study options include how to define constant amplitude event interaction, how to compute alternating stress, and how to define the shell face.
Random Vibration – Fatigue of Random Vibration study options include how to define the computational method as well as how to define the shell face.
#6. Run the analysis
Typically, a fatigue analysis runs very quickly. The reference studies are not rerun.
#7. Postprocess the results
Three plots are available to help evaluate the results of the analysis:
- Life plot
- Damage plot
- Factor of safety plot
The life plot depicts the number of cycles that causes failure at a model location (i.e. mesh node point). For example, a life plot may show a specific node point with a value of 150,000. This means that point can withstand 150,000 cycles before failure. The life plot is only available when a single event is defined for the analysis.
The damage plot depicts the percentage of damage at a model location. A value of one indicates that the defined fatigue event consumes 100 percent of the model life and it will have cracked at that location after the given number of cycles.
The factor of safety plot is very similar to the factor of safety plot for static analysis. A factor of safety of two at a model location predicts fatigue failure at that location when the applied loads are multiplied by two.
I hope you found this blog on SOLIDWORKS Simulation fatigue analysis helpful. For more SOLIDWORKS tips, tricks, and industry news subscribe.
SOLIDWORKS CAD Cheat Sheet
Our SOLIDWORKS CAD Cheat Sheet, featuring over 90 tips and tricks, will help speed up your process.

About Derrick Franklin
Derrick is an Engineering Manager in Northern California. He assists in both pre-sales and post-sales capacities for the SOLIDWORKS software as well as serves as an Enterprise PDM Product Specialist. Derrick received his Bachelor’s degree in Biological Engineering from Mississippi State University and has a Master’s degree in Mechanical Engineering from the University of Utah. He is also a Certified SOLIDWORKS Expert and a Certified PDM Professional.
Get our wide array of technical resources delivered right to your inbox.
Unsubscribe at any time.