Scaling Data in CST Studio Suite & Mixing Measured with Simulated Data

Table of Contents
The CST Studio Suite Waveguide and Discrete S-parameter ports are excited using one watt peak power. However, designers do not always use one watt as the input power level. Scaling simulation results to match the actual design can be achieved in a few different ways.
Combine Results Method
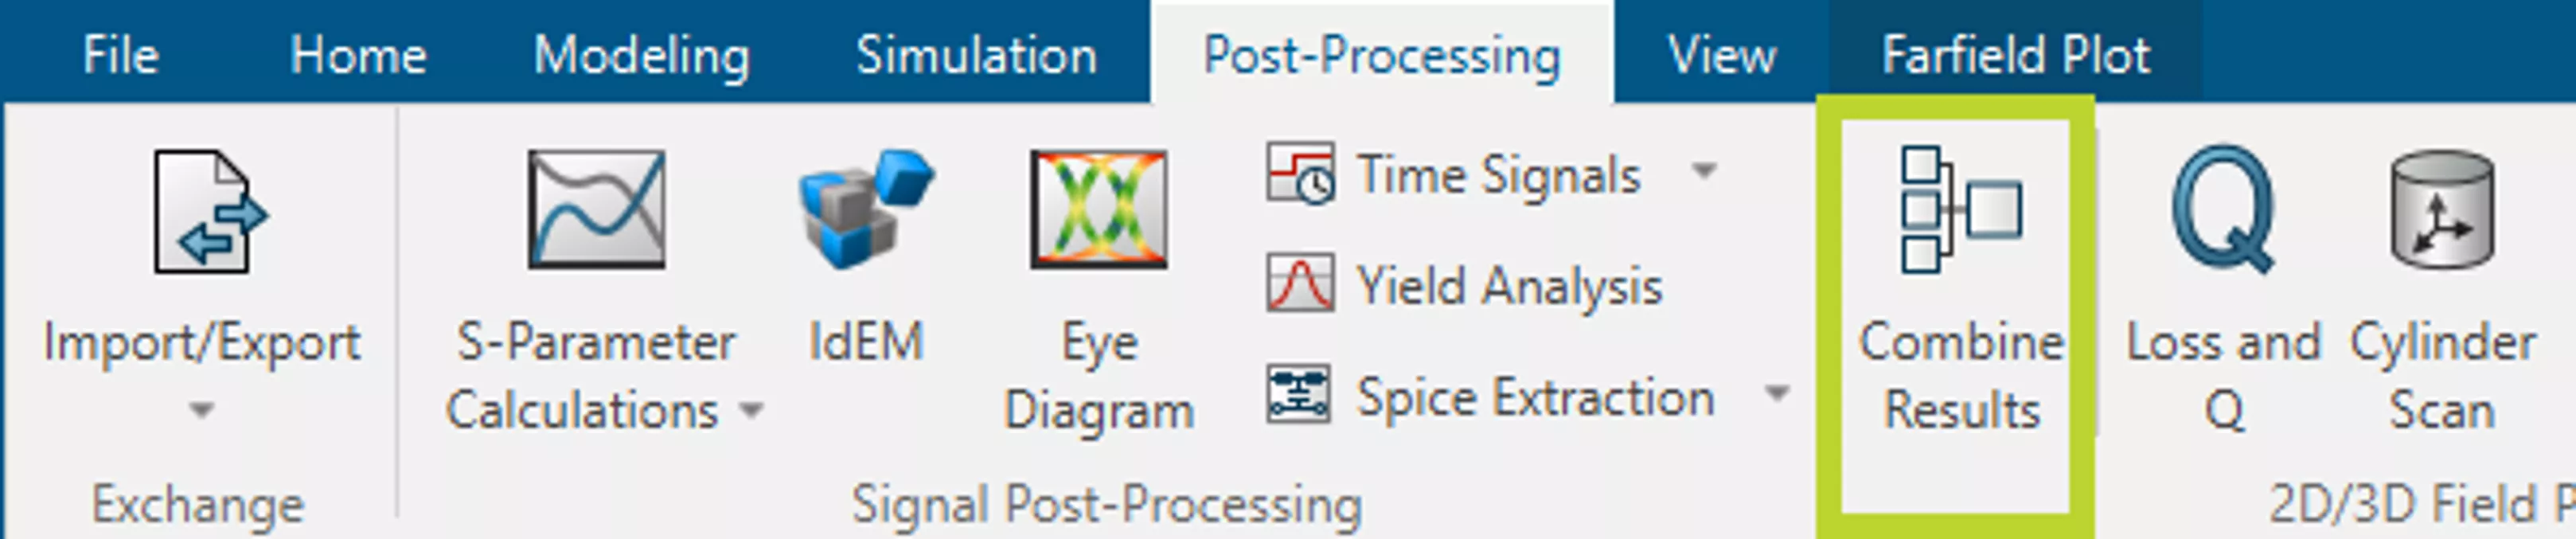
One solution is to use the Combine Results feature located in the Post-Processing ribbon.
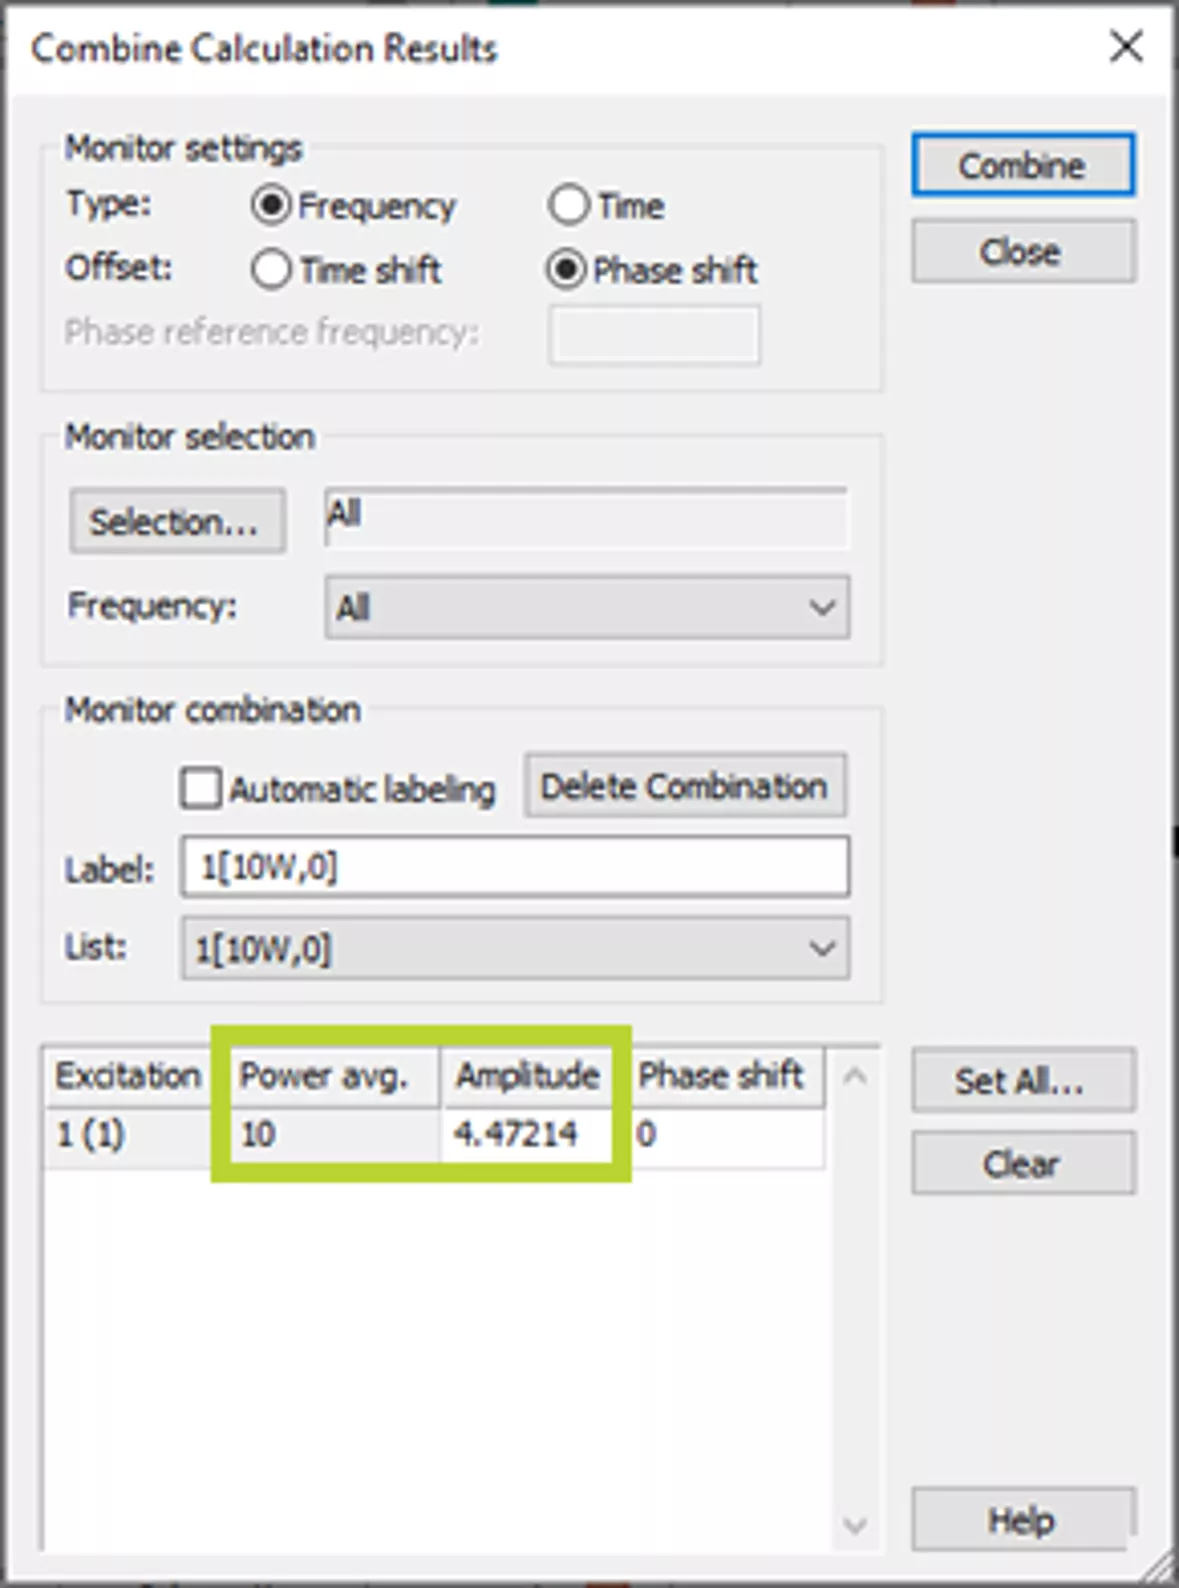
Once the Combine Results feature is selected, choose the desired monitor(s) to be scaled. The Monitor settings section (1) gives the option to select a frequency or time monitor, and the Monitor selection (2) allows you to select specific monitors or all of them. By default, the Automatic labeling option is turned on (3). If you want to change the names of the monitors, uncheck this box to provide control over the labeling.
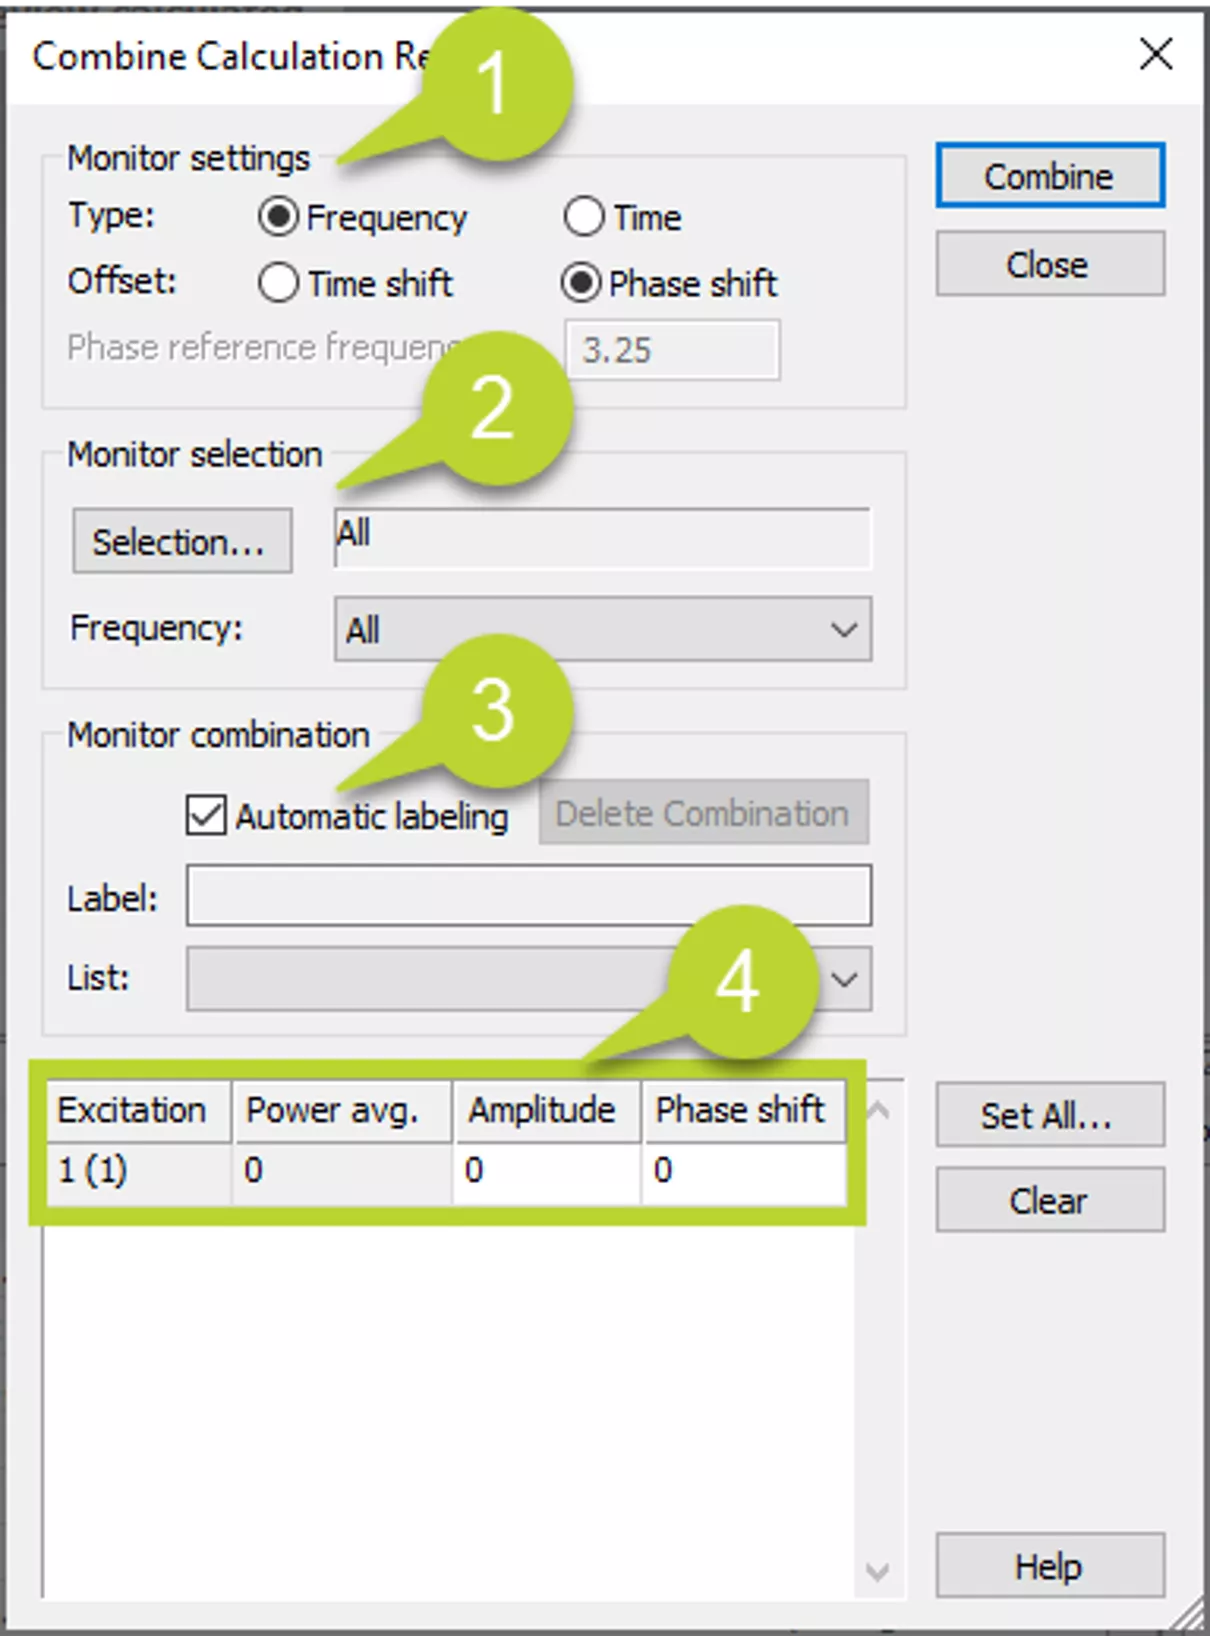
The last item to change is the Amplitude (4). This allows you to change the power. The Power avg. relates to the Amplitude as follows:
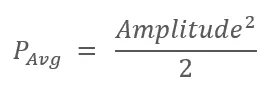
Which can also be written as:
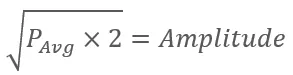
For a 10 W input, a user would set the amplitude to  . Select Combine, and the new results will be added to the Navigation Tree with the corresponding field monitor results.
Design Studio Method
Another method of scaling simulated data is through Design Studio, which can be accessed by selecting the Schematic tab in the bottom-left corner of the 3D window. In Design Studio, connect an External Port to the pin of the 3D model.
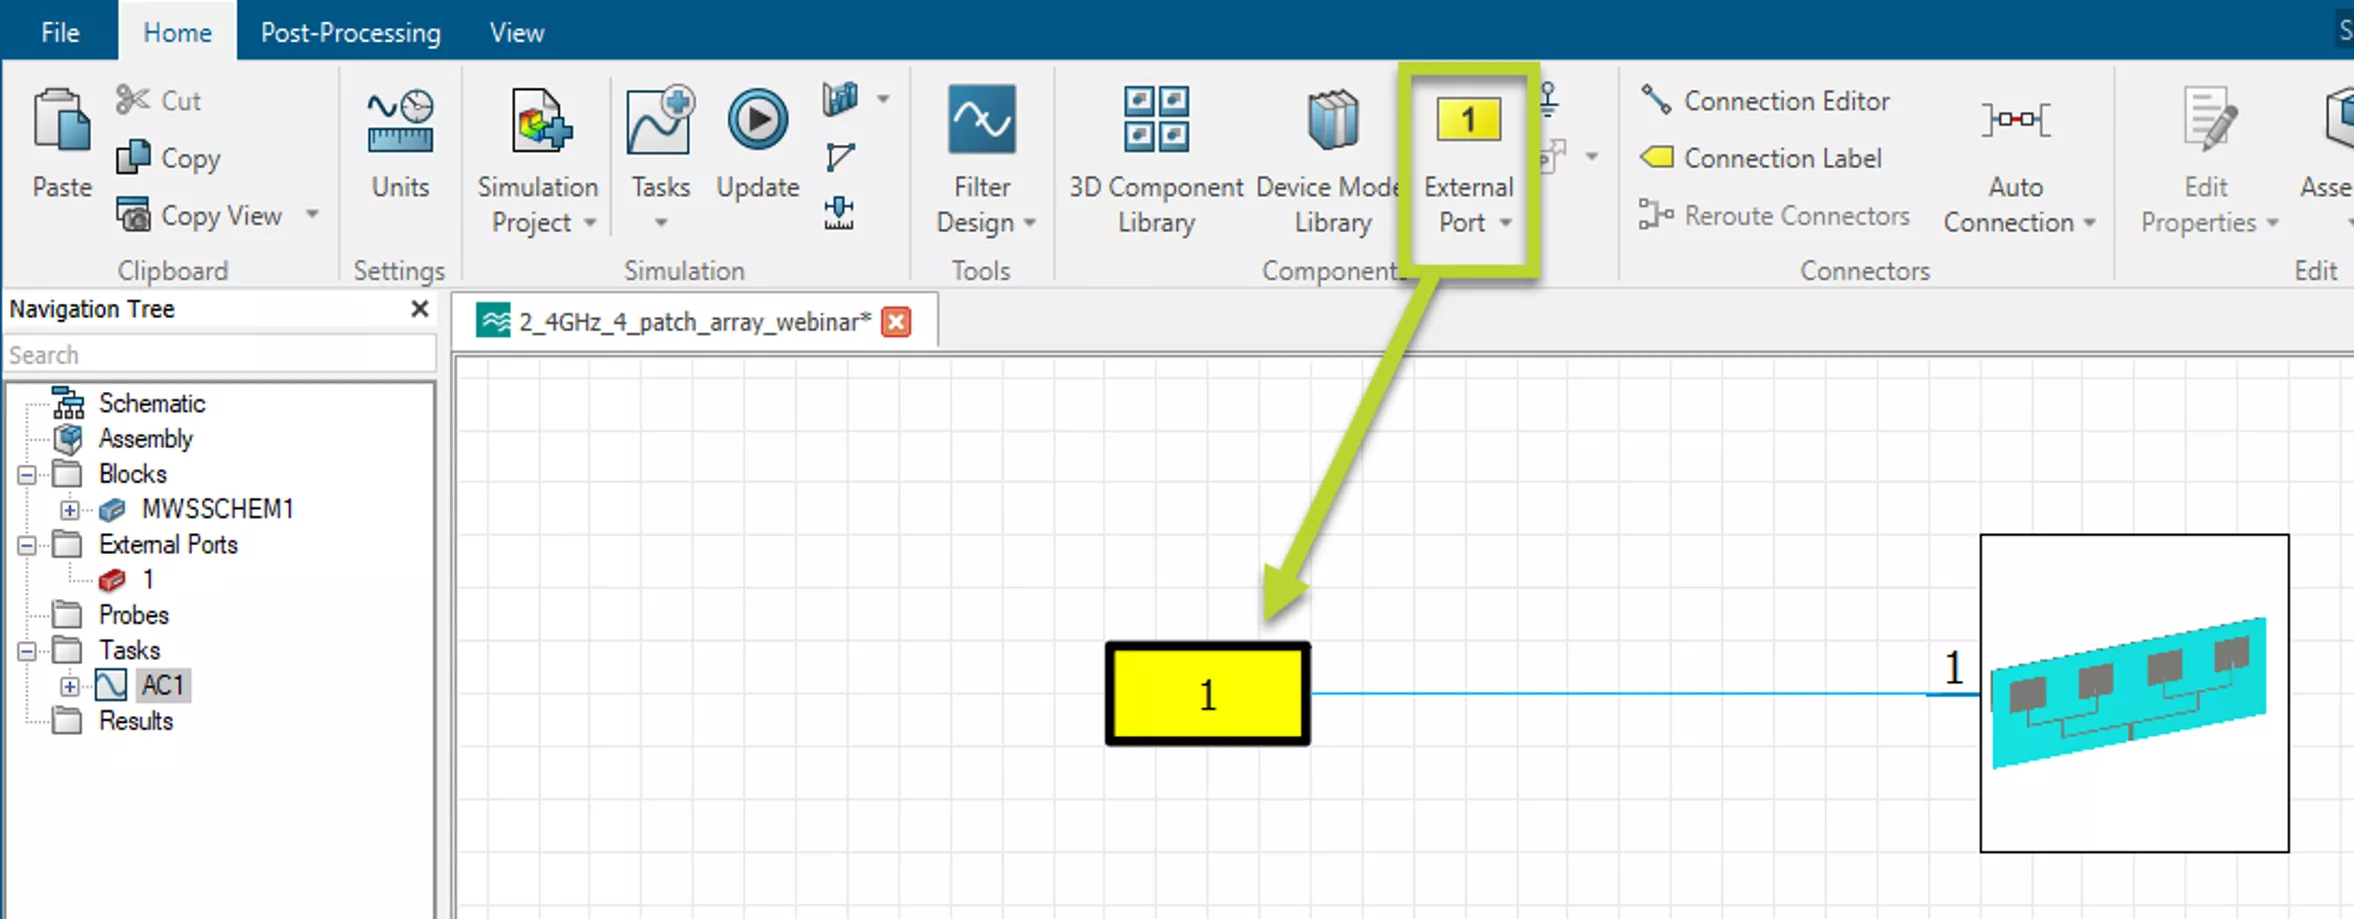
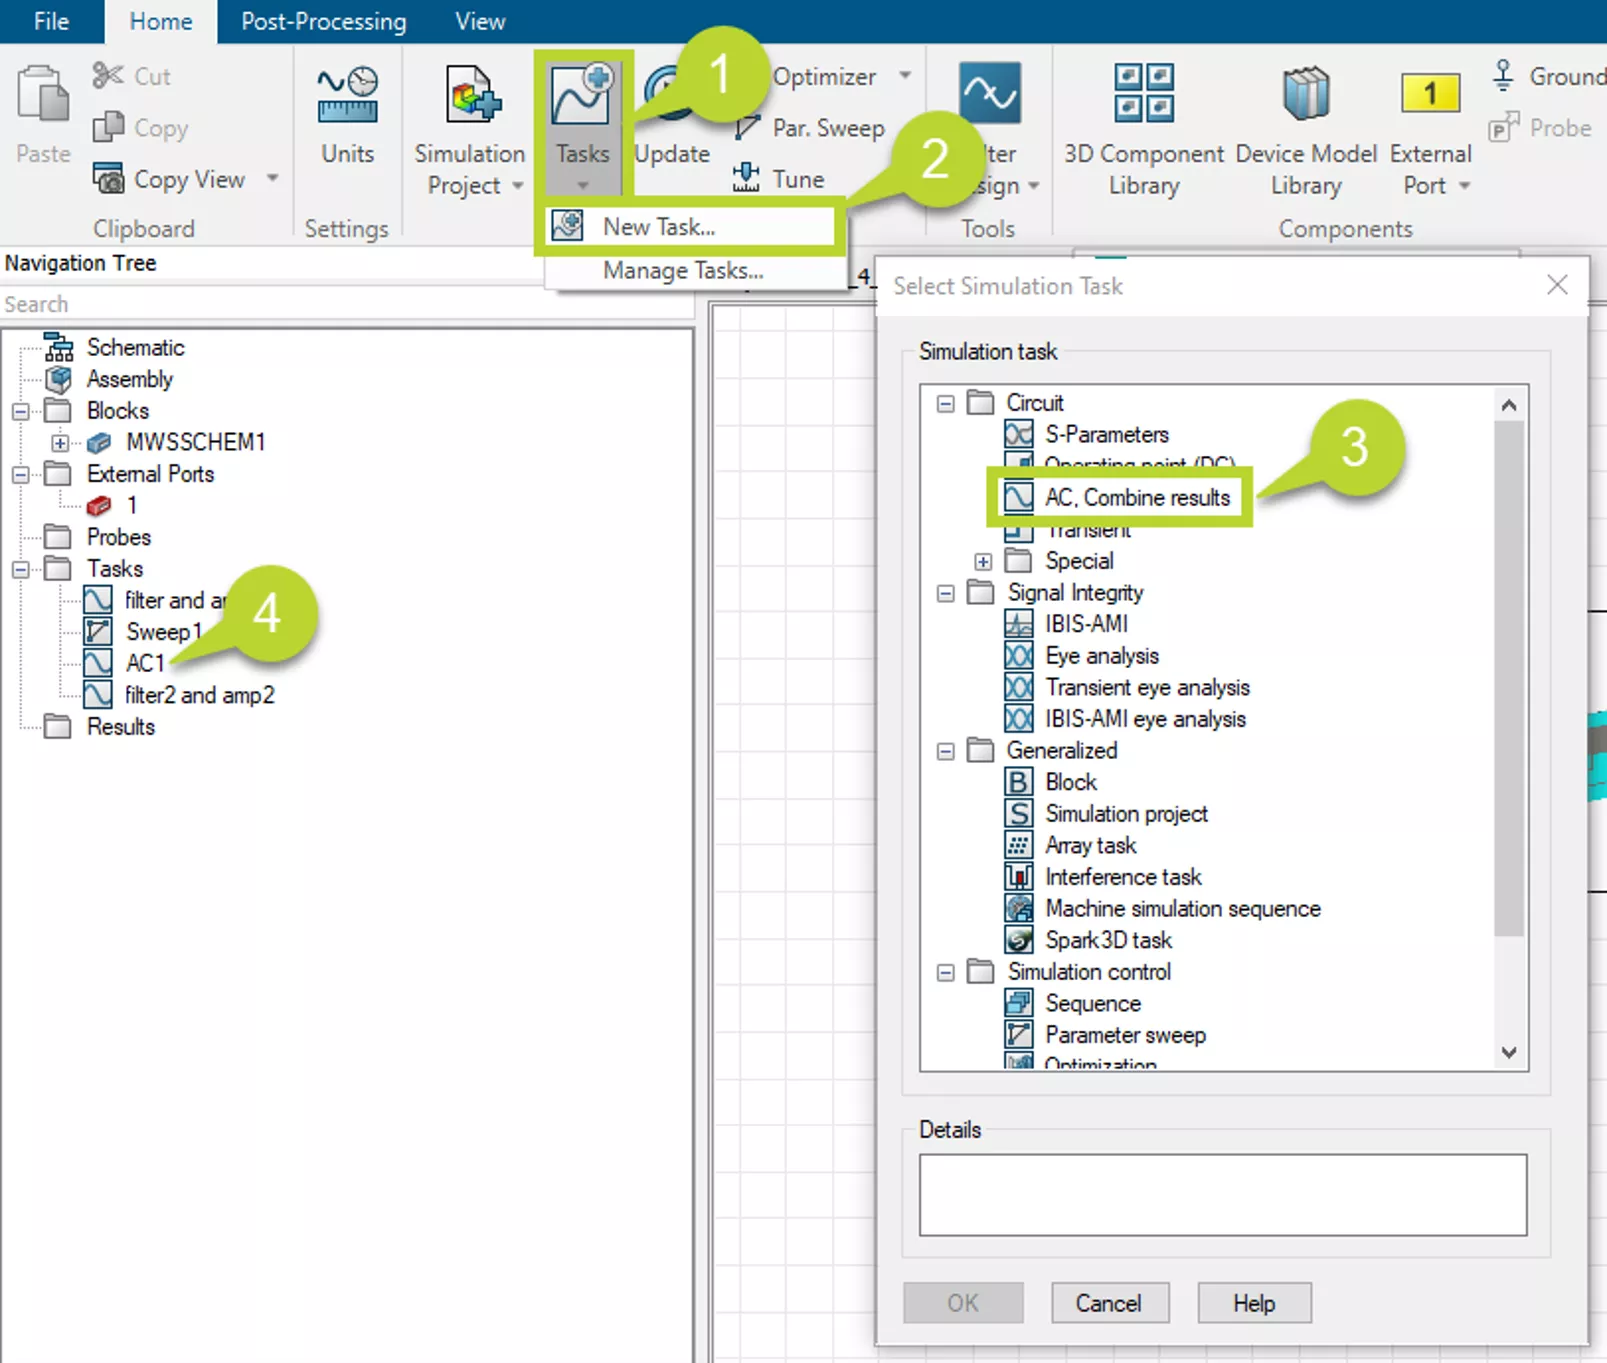
This port allows you to define the excitation to just about anything. For changing the level, an AC Task is added to the Task list in the Navigation Tree. This is accomplished by selecting Tasks (1) and then New Task (2) to open the Select Simulation Task window. Select the AC. Combine results task (3). This will add the AC1 task to the Navigation Tree (4).
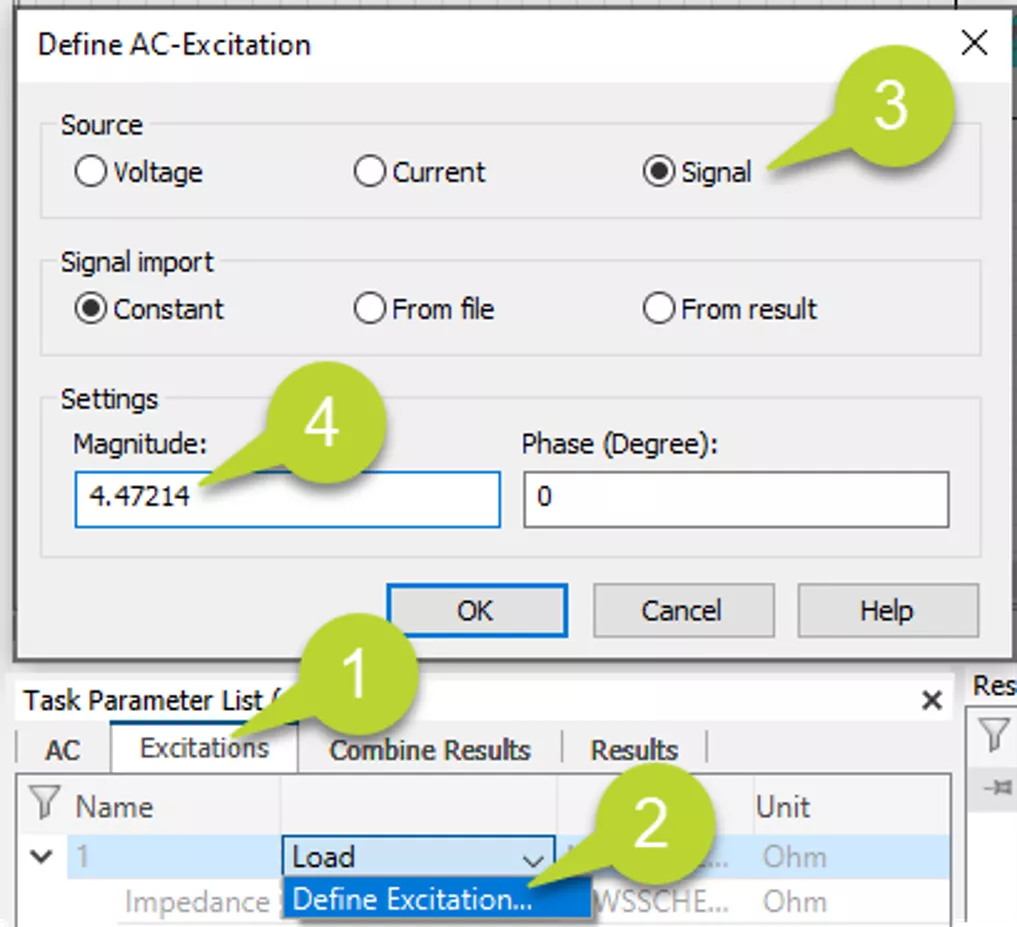
The Task Parameter List is used to set up the task. First, select the Excitations tab (1). All the External Ports will be listed here and can be modified. By default, they are defined as a Load. Select Load and Define Excitation… (2) to open the Define AC-Excitation window. Select Signal (3) and set the Magnitude to the same as discussed previously. This will set the average power input to 10 W.
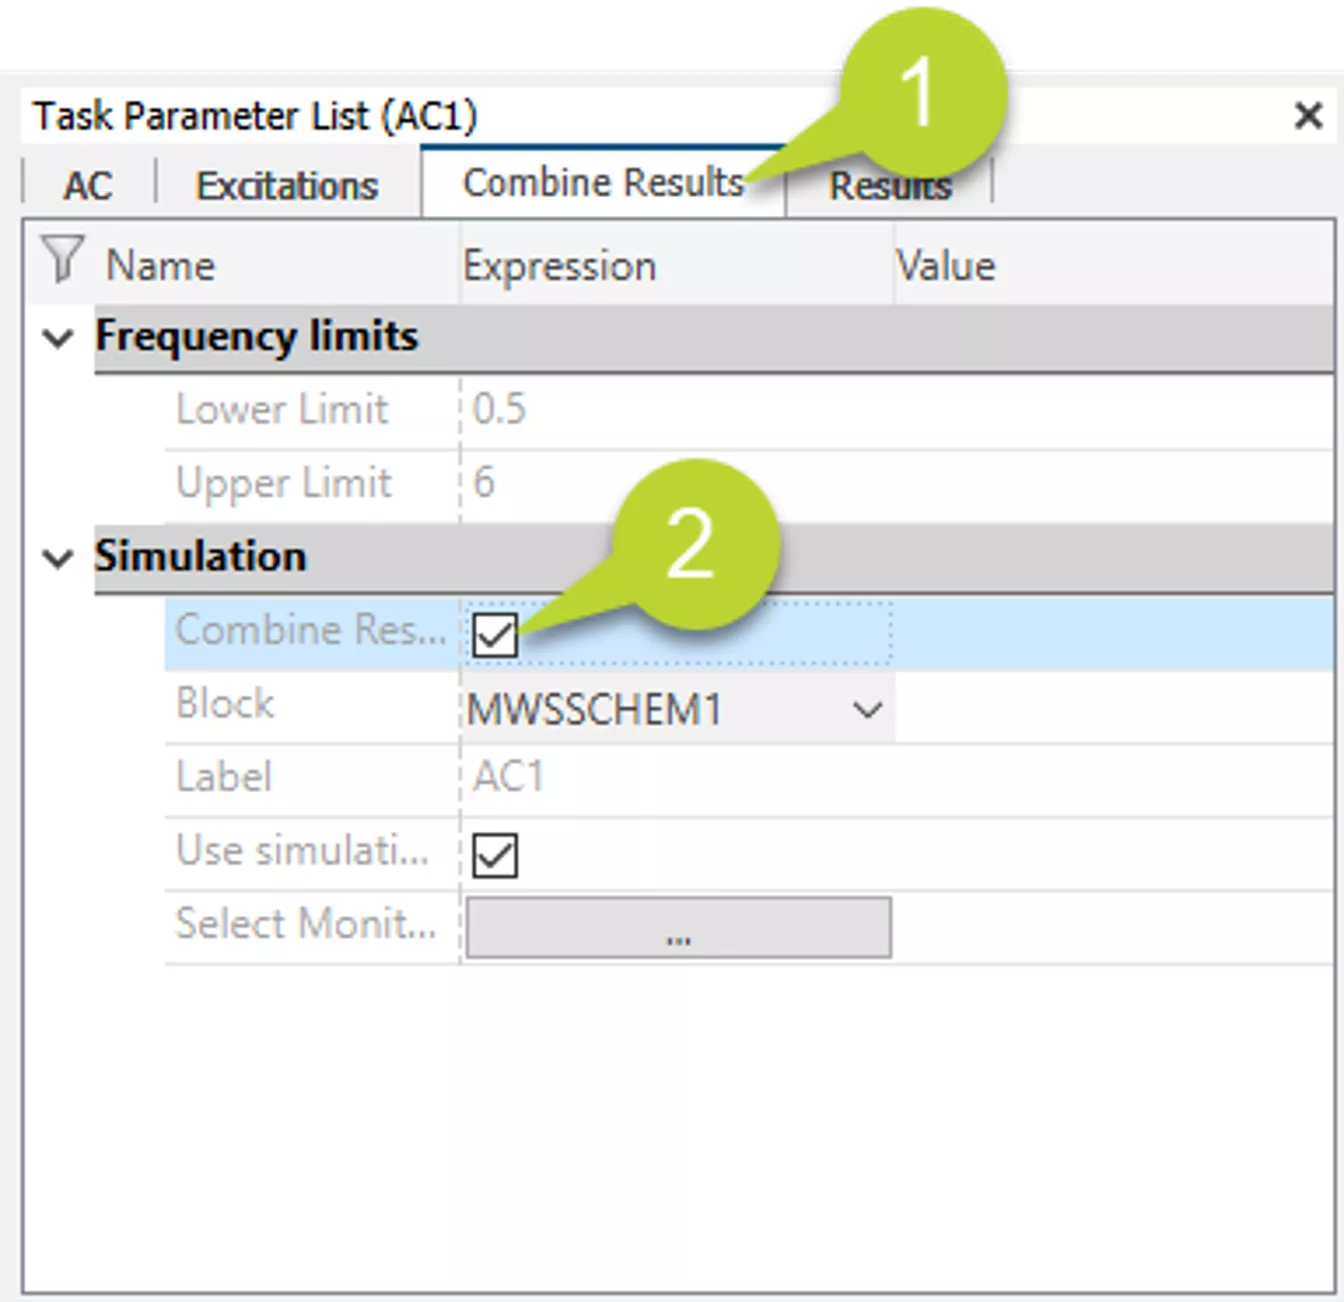
The final setup is to switch to the Combine Results tab (1) and select the check box Combine Results (2). This will update the 3D field monitor results when the task is updated. Select Update from the Simulation section of the Home ribbon. Once the simulation is complete, switch back to the 3D tab and view the 2D/3D Results. The original results will be listed with the new results.
Mixing Measured and Simulated Data
Let’s consider this 2.4 GHz four-patch antenna array.
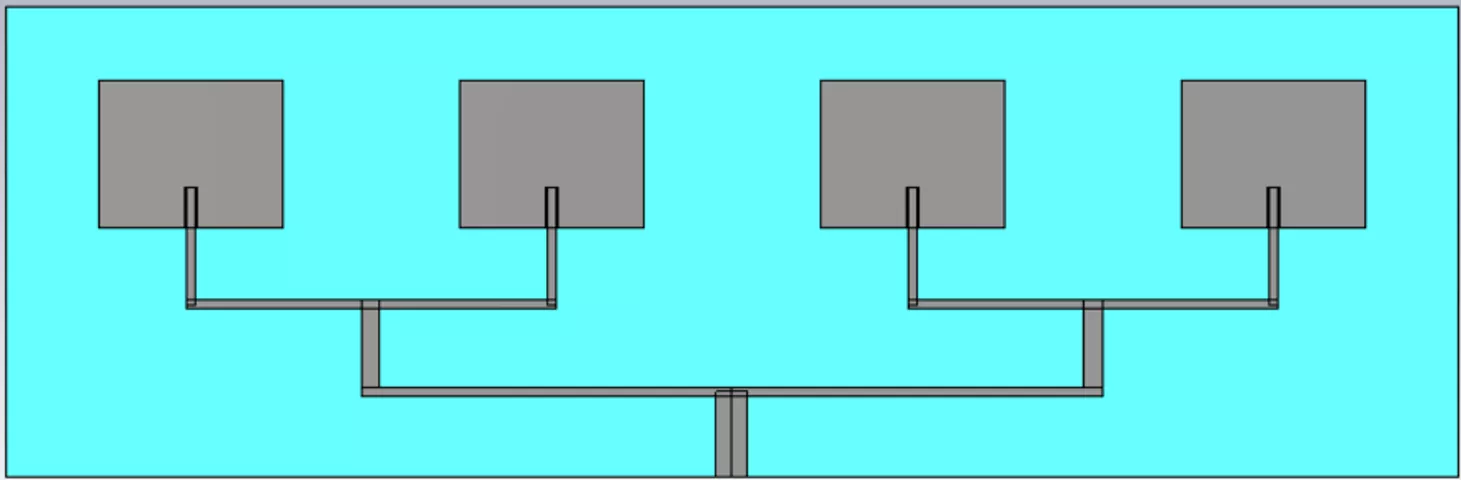
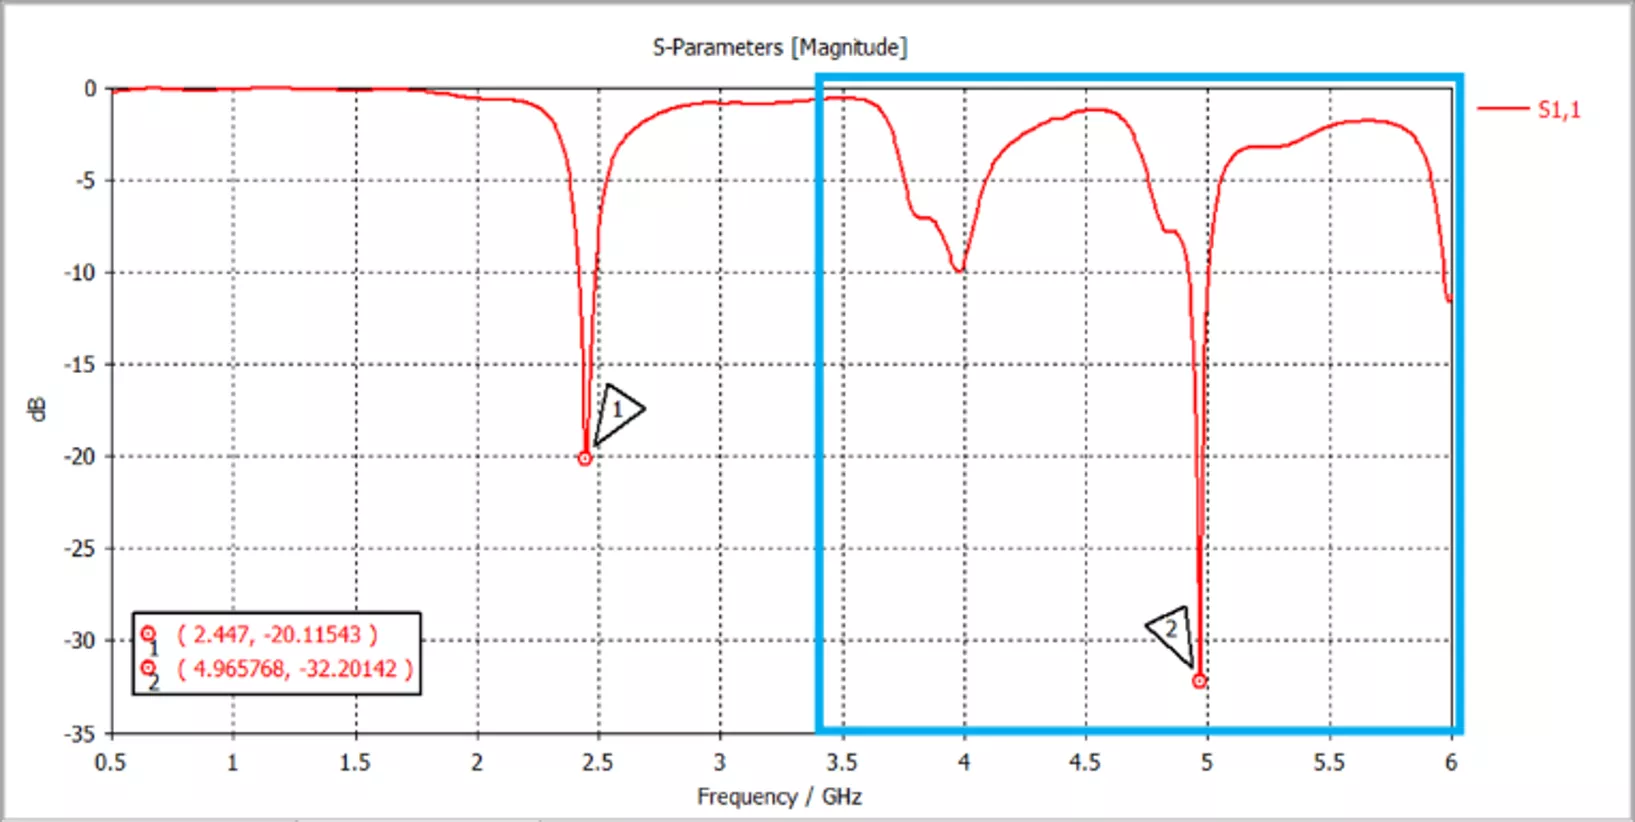
The final design will require a filter and amplifier for successful operation. The full-wave simulation from CST Microwave Studio will calculate the return loss of the antenna, which will tell us what frequencies will transmit most efficiently.
The return loss contains resonances at both 2.45 and 4.97 GHz. This may be ideal for a wireless antenna designed to work at both 2.45 and 5 GHz; however, only the 2.45 GHz frequency is desired for this design.
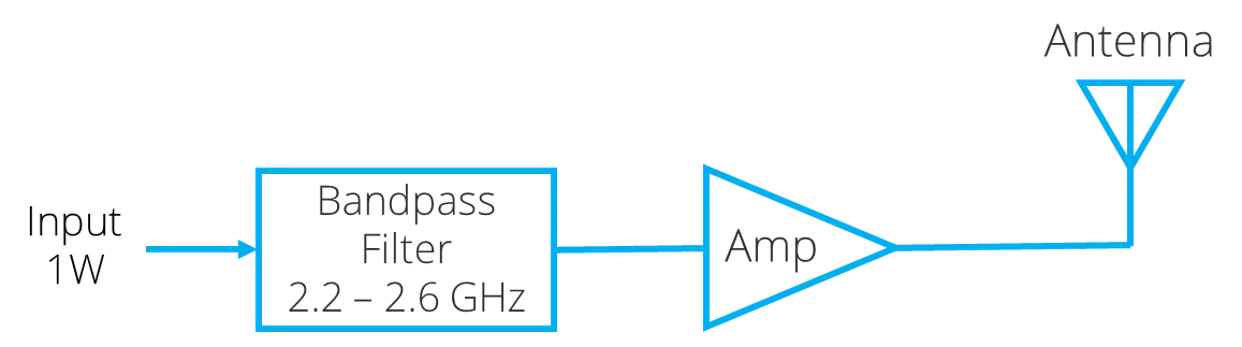
To achieve this, a bandpass filter will be used along with an amplifier. CST Studio Suite’s Design Studio is used to quantify which amplifier and filter will work best.
A simple block diagram illustrates the design, which looks very similar to the Design Studio setup. An External Port is placed for the input of the filter. The filter and amp are brought in using Touchstone File Blocks, which are found in the Data Import section of the Block Selection Tree.
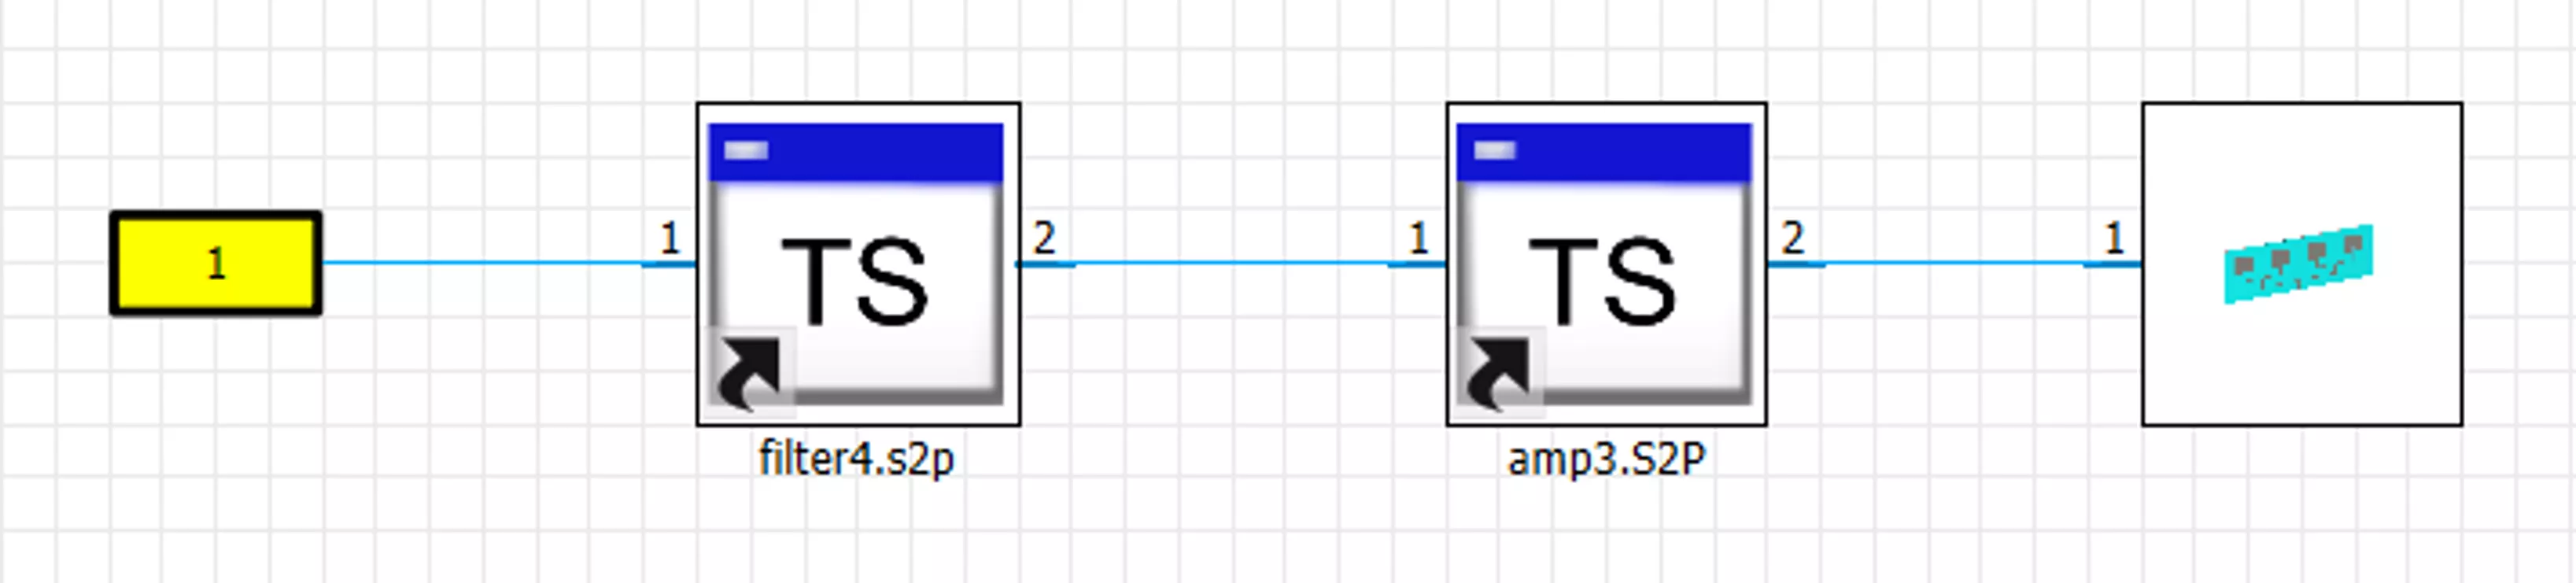
The S-parameter data is imported as a touchstone file for both the filter and the amp. The data can be seen for each touchstone block by finding it in the Blocks section of the Navigation Tree. Right-click on the block in the Navigation Tree and select Show S-parameters.
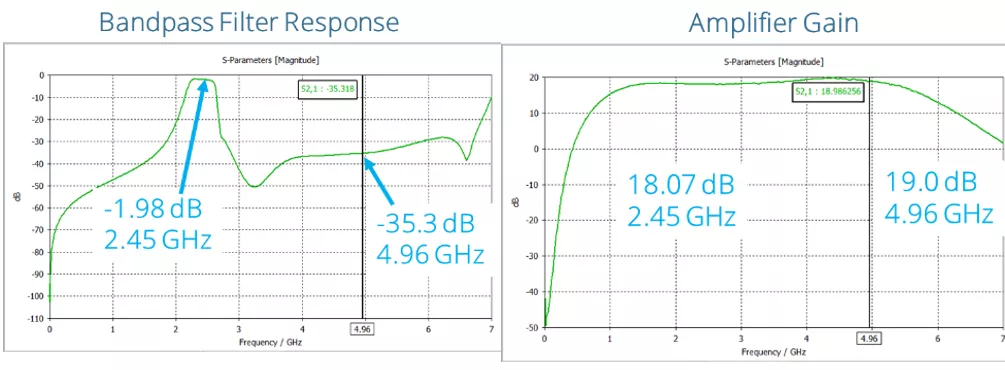
The data will be imported and added to the Navigation Tree. We can view the S-parameters and determine how well each part will affect the design. This can be used to get some expectations for the simulation and can be added to the block diagram to calculate the path loss and gain.
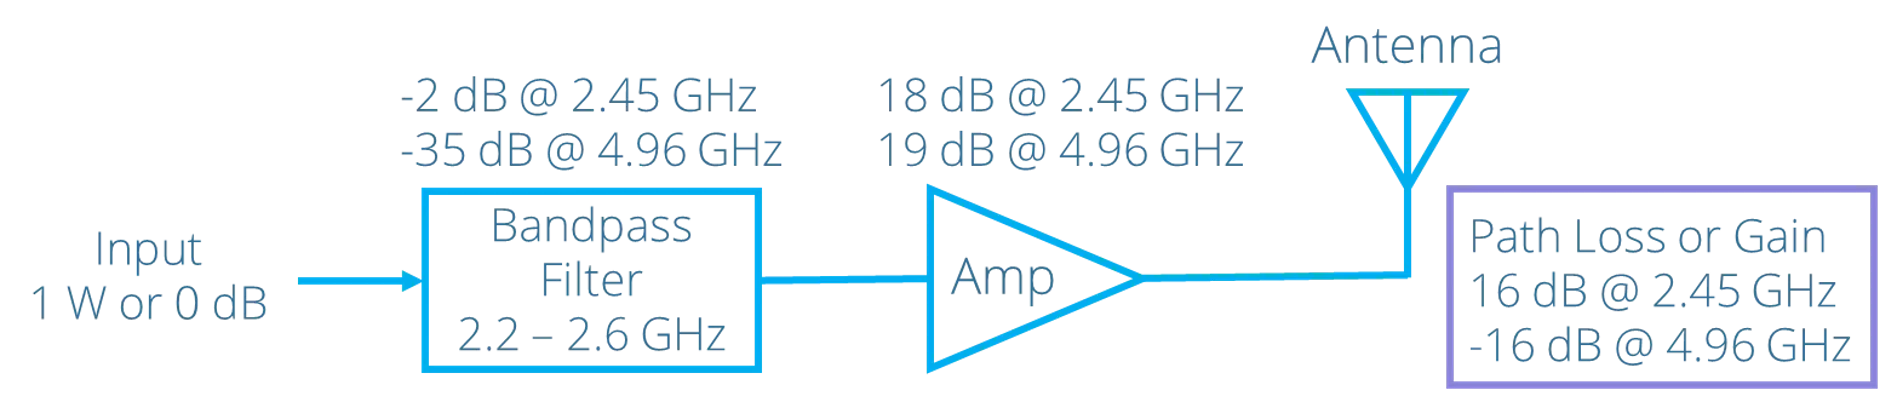
The gain of the signal for 2.45 GHz should be 16 dB, while the loss at 4.96 GHz should be 16 dB. With these expectations, we can check the results.
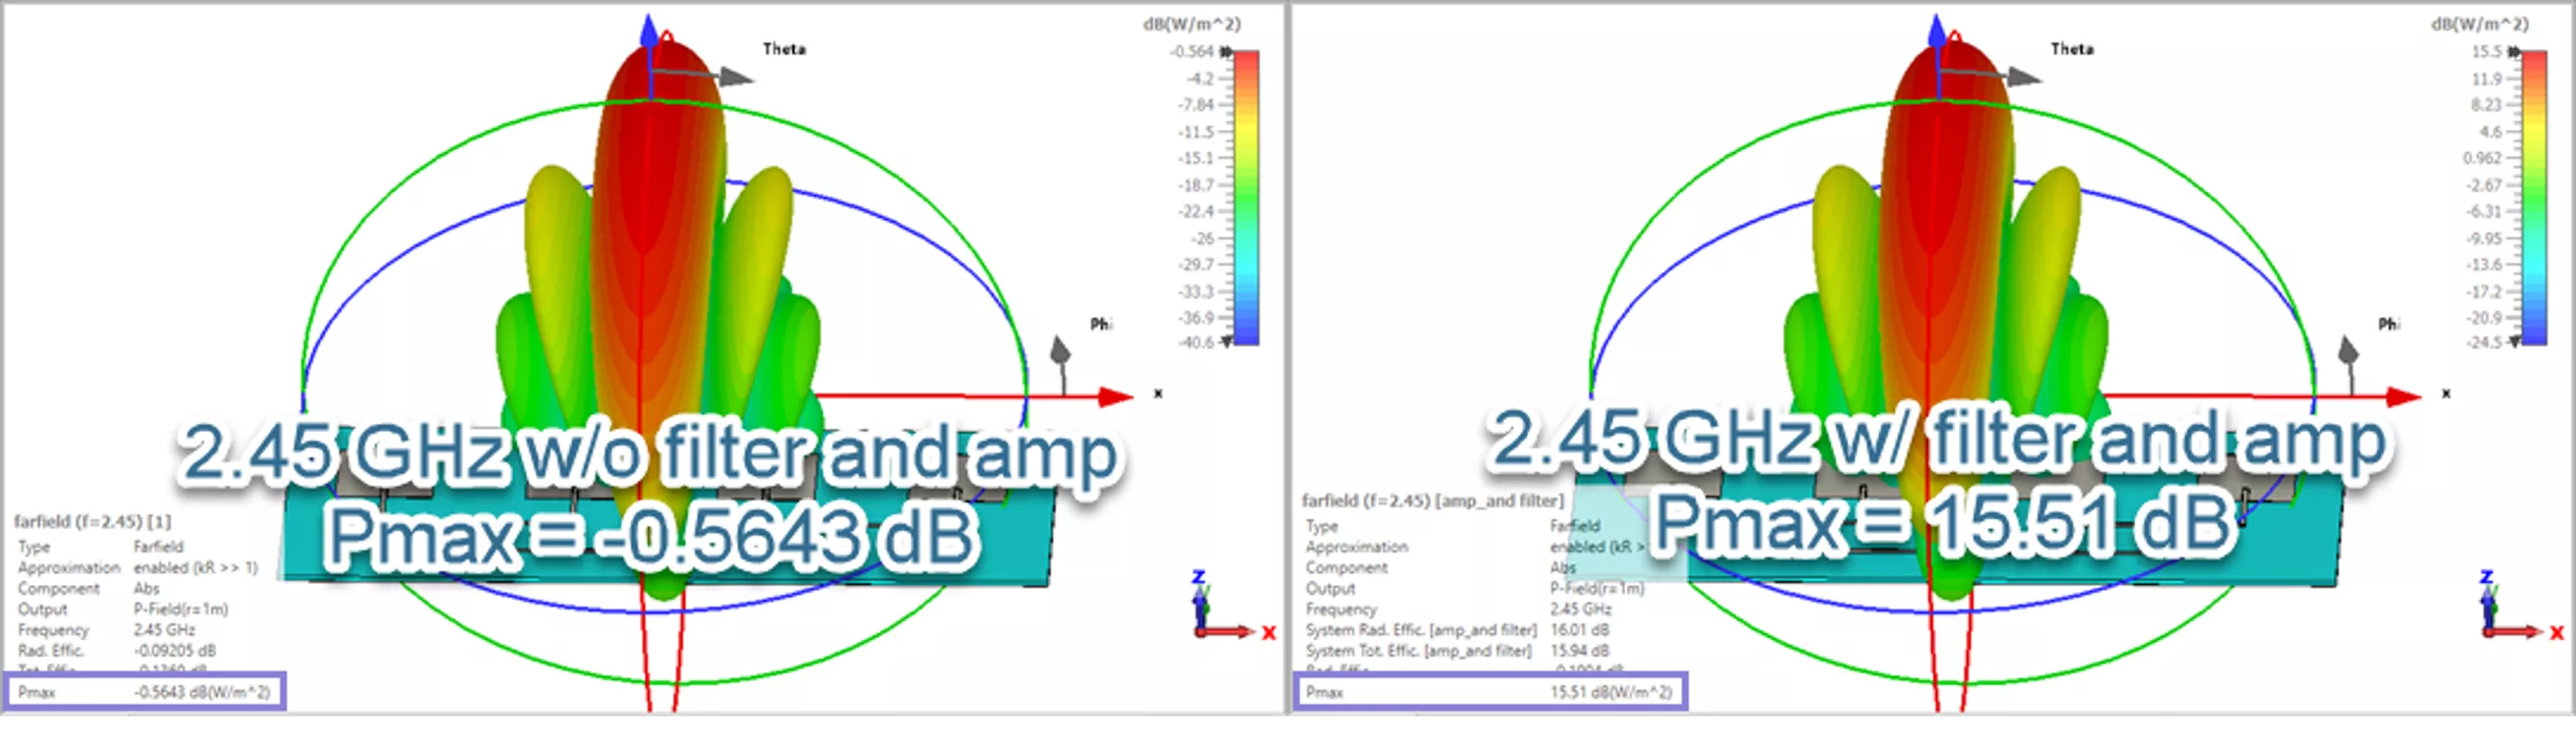
Comparing the max power for the 2.45 GHz farfield results shows a 15.436 dB gain. Likewise, comparing the max power for 4.96 GHz shows a 16 dB loss. The expectations match the results, which confirms the method works.
Conclusion
CST Studio Suite provides a way to scale result data through Combine Results and Design Studio. Design Studio also allows users to bring in measured data to mix with the simulated results to see how the simulated model will work with the rest of the system. This provides a powerful tool for the designer to develop and simulate the full system in one tool.
CST Studio Suite 2025 Buying Guide
What you Need to Know Before You Buy
CST Studio Suite is high-performance design & simulation software for electromagnetics. What are its key strengths, features, packages, and hardware requirements?
This guide provides answers.
Questions?
If you'd like to speak to someone and ask questions directly, please contact us.
Related Articles
Simulation-Driven Antenna Design Optimization with CST Studio Suite & Tosca
CST Studio Suite Hybrid Solver for System-Level Electromagnetic Analysis
Advancing Engineering Simplicity: SIMULIA’s New Unified Licensing Model

About Clint Patton
Clint Patton is a Sr. Simulation Applications Engineer with a specialty in Electromagnetics. Clint started using simulation tools while working on his Master's Degree with the Missouri S&T EMC Laboratory. He has over 16 years of experience designing, simulating, and testing electronic devices. He started working with GoEngineer in February 2023 supporting CST Studio Suite. He enjoys working on RF, EMI/EMC, and signal and power integrity problems. In his free time, Clint enjoys being outside fishing, hunting, and camping.
Get our wide array of technical resources delivered right to your inbox.
Unsubscribe at any time.